Technical Support
Calibration Support Procedures
Click the headings below to view the calibration support procedures for your type of calibration.
If you don't find a procedure to solve your calibration, you can always contact your support representative at 1-800-872-7728 or email us at support@thunderscientific.com
Calibration Tutorials
Thunder Calibration Support
Hygrometer Calibration
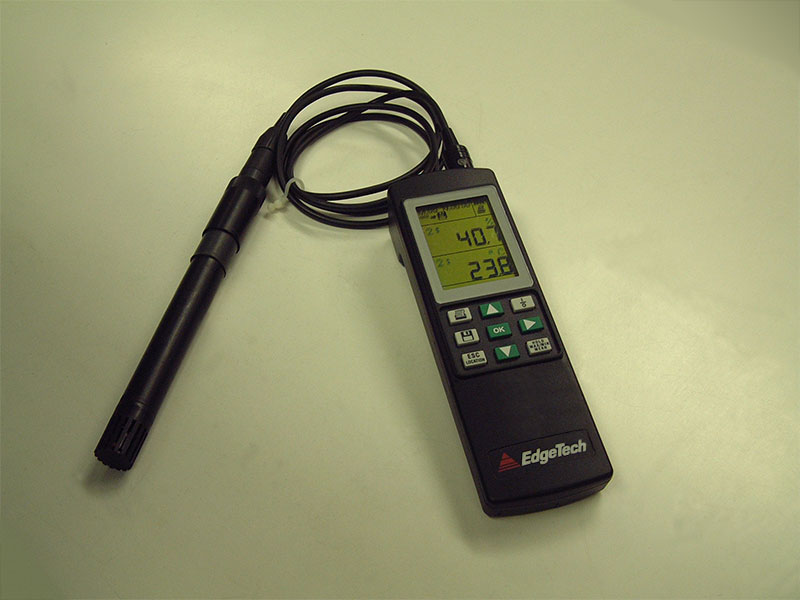
Figure 1.1
A typical hand held hygrometer with humidity and temperature probe Edgetech Model 650. Typical accuracy for this hygrometer is specified at ±2.0 %RH
The calibration of the hand held hygrometer as described and illustrated will be a simple 3 point calibration at 20, 50, & 80% RH at a test temperature of 23 °C.
It is always a good idea to review the operations manual for the instrument you will be calibrating.
For this calibration use the manifold accessory in the test chamber of the 2500. The manifold will thread into the chamber inlet port with a ¼ inch NPT male thread. It is not necessary to seal or tighten the manifold tight.
The manifold accessory will reduce the calibration test time.
Bundle the RH/Temp probe and the chamber temp sensor from the 2500 together in the manifold as illustrated. It is important that the RH/Temp probe from the hygrometer is positioned with the 2500 chamber temp sensor.
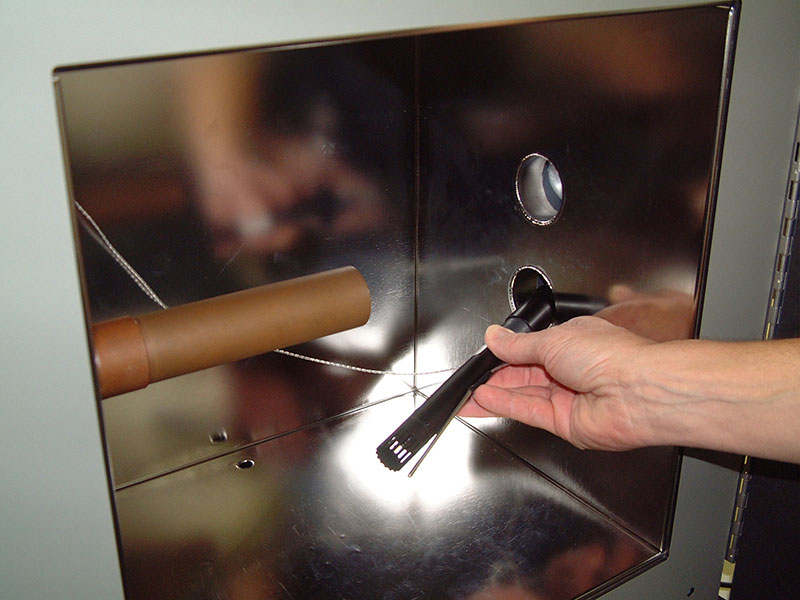
Figure 1.2
Position the RH/Temp probe into the manifold fixture with the 2500 chamber temperature sensor. Close the chamber door.
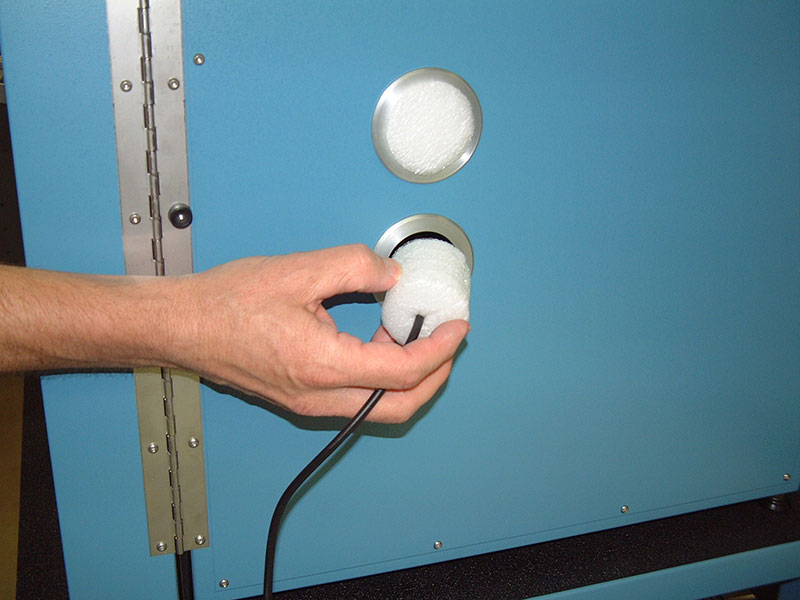
Figure 1.3
Seal the access port with the white foam plug, the foam plug can be drilled or cut for the probe cable.
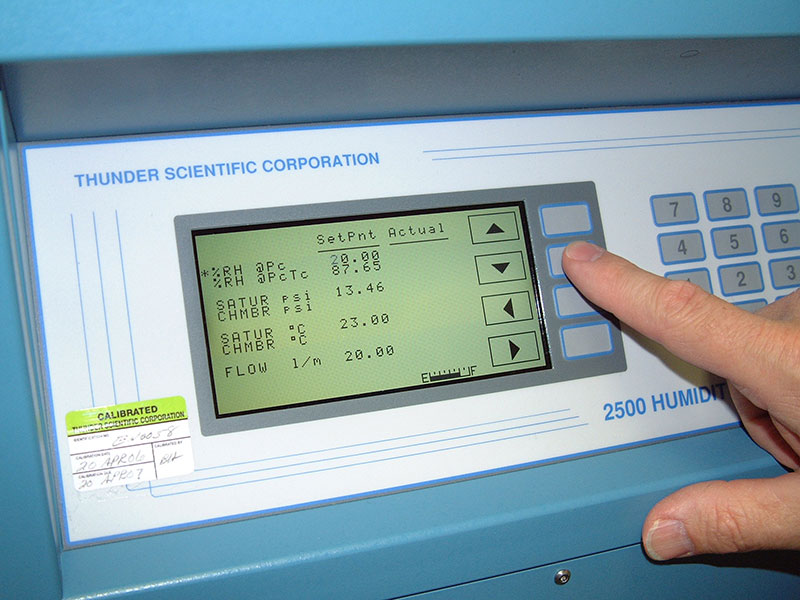
Figure 1.4
Change the set point on the 2500 control screen to 20% RH at PC/TC, change the chamber temperature set point to 23 °C.
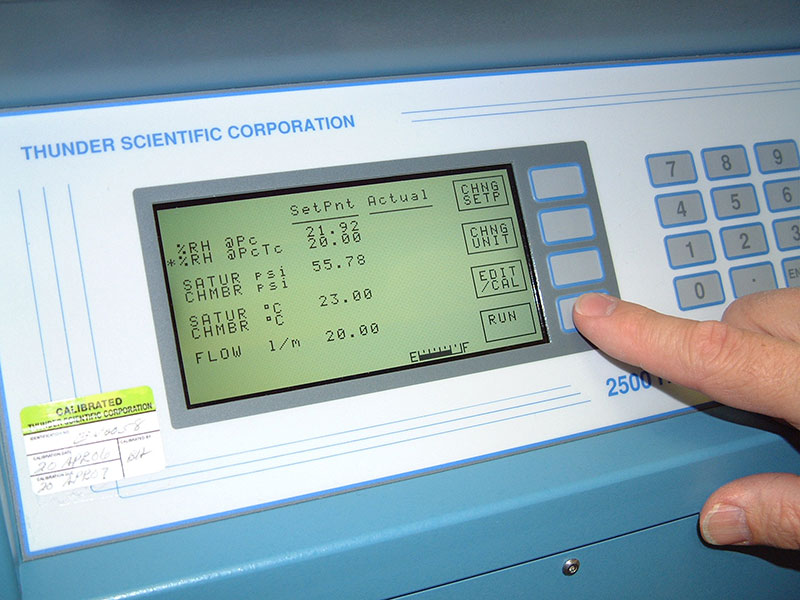
Figure 1.5
Press RUN to start the 2500 and begin the calibration. As a rule of thumb we will allow the 2500 system and hand held hygrometer to warm up for 60 minutes before taking our first test point. The test point interval will be 30 minutes after the initial warm up.
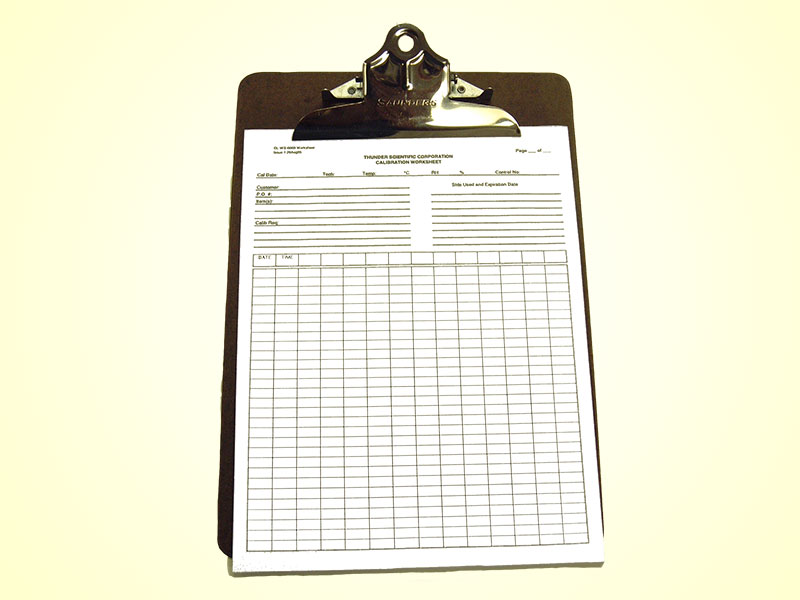
Figure 1.6
Thunder metrologists use a calibration worksheet to record data from the 2500 and the device under test. Ambient test conditions in the lab are noted and dated on the work sheet. Data collected from the 2500 will include the headings as listed in this example.
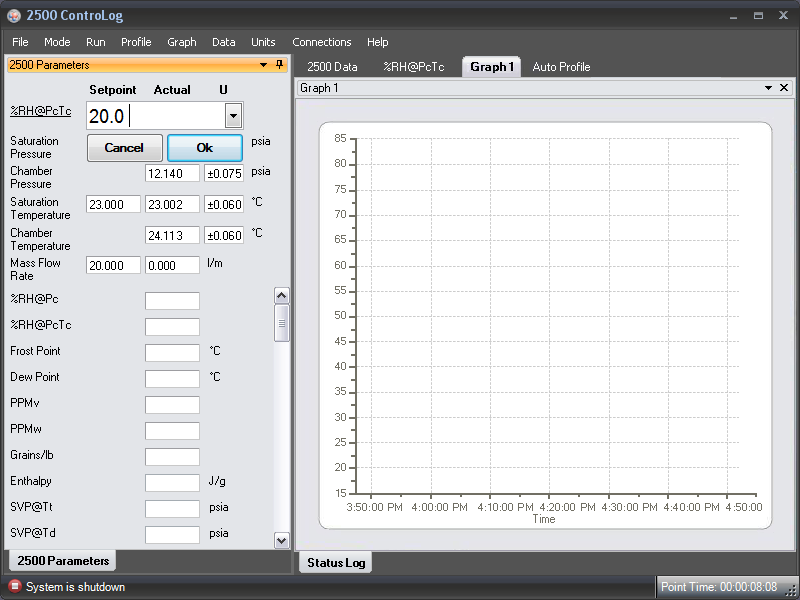
Figure 1.7
ControLog® Automation software can be used in place of the manual set points as described in the previous section. Click on the %RH Set point field of the Control Parameters window, the dialog box will appear, using the keyboard enter a set point of 20 then click OK.
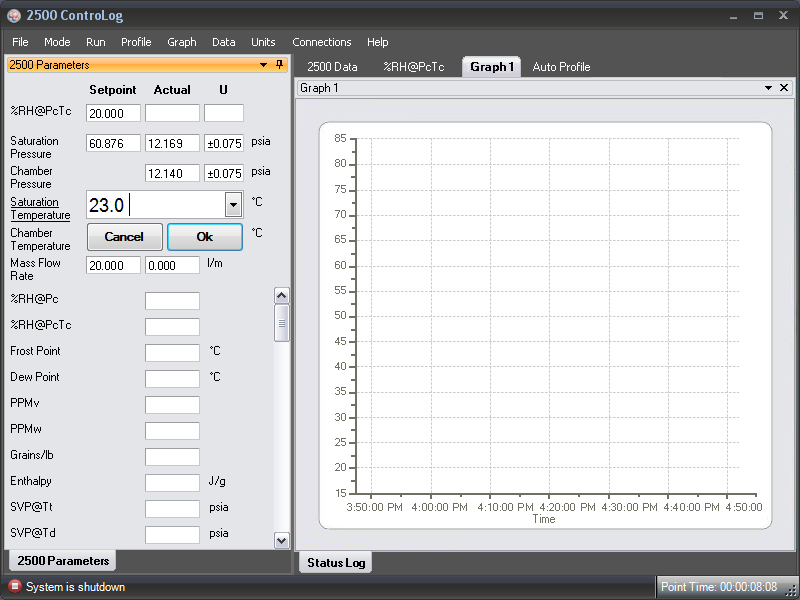
Figure 1.8
Click on the Saturation Temp Set point field of the Control Parameters window, the dialog box will appear, using the keyboard enter a set point of 23 for a chamber temperature of 23 °C and then click OK.
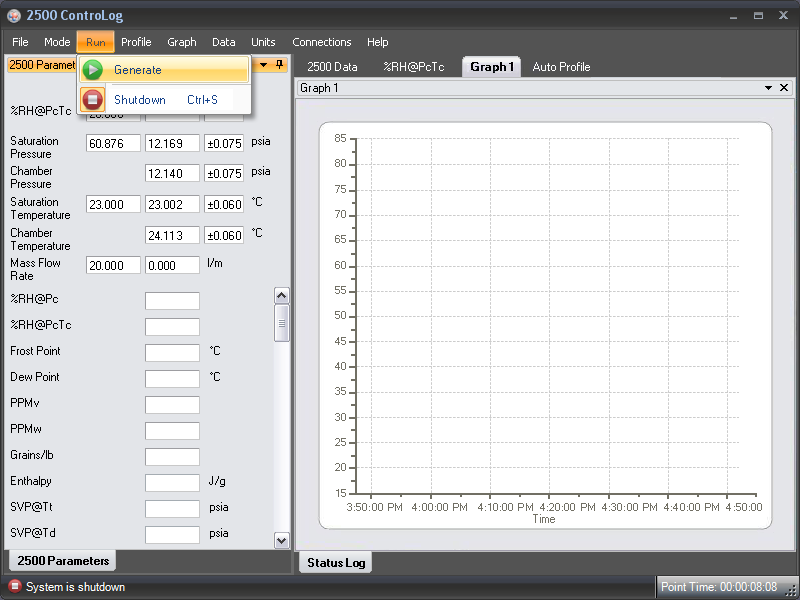
Figure 1.9
Select Generate from the Run menu and click. When Generate mode begins, all fields on the Control Parameters window and the Calculated Humidity Values window begin to update, and the Status Log shows the time that the Generate Mode was started.
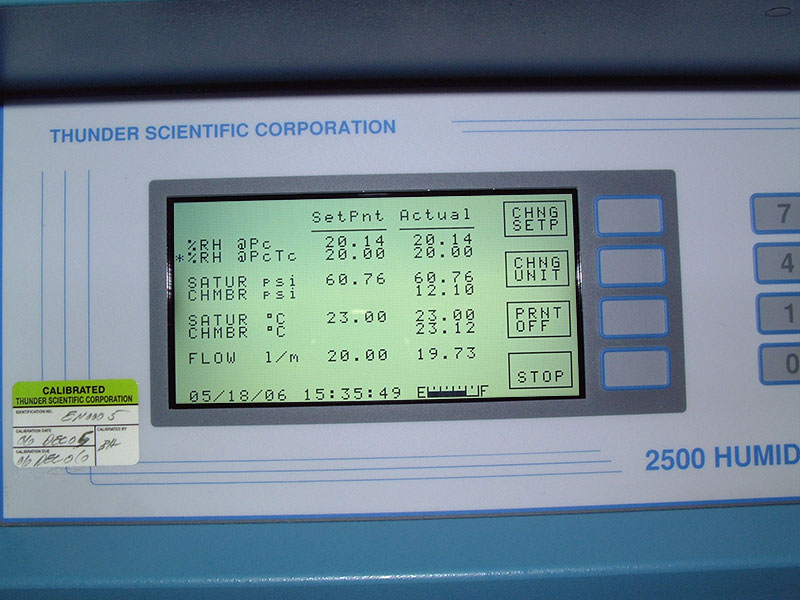
Figure 1.10
After 60 minutes we are ready to take a test point at 20 %RH at 23 °C. Record the readings from the 2500 and hand held hygrometer. Allow extra time if the DUT is still stabilizing at the test point.
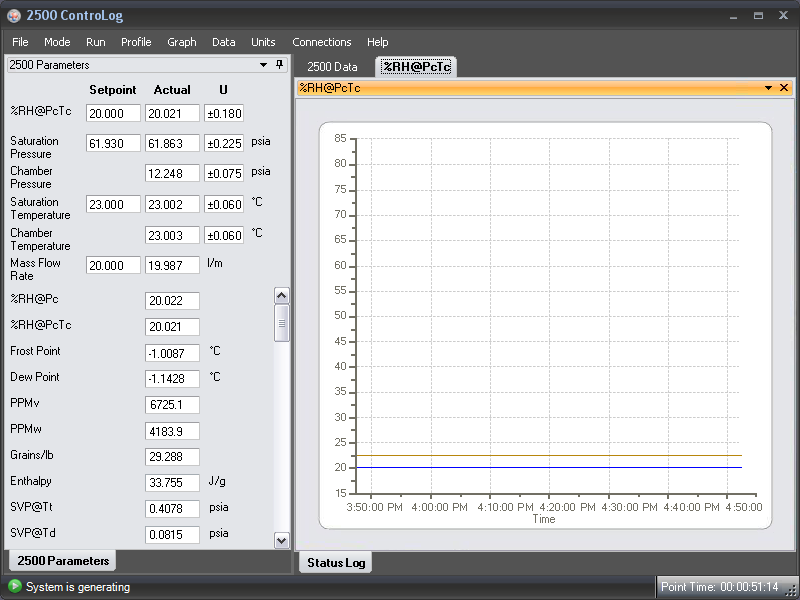
Figure 1.11
ControLog® Automation screen in the graph mode shows a stable set point at 20 %RH and 23 °C chamber temperature.
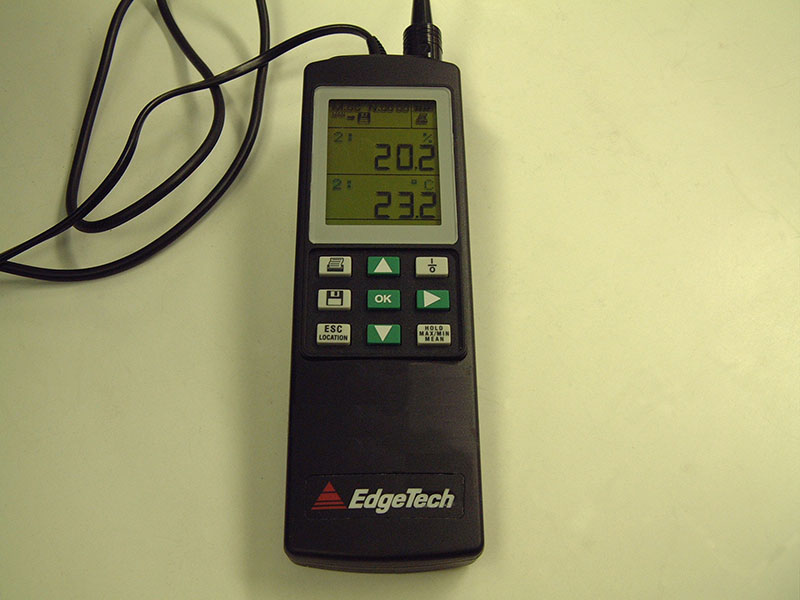
Figure 1.12
The displayed output values from the hand held hygrometer should be recorded for %RH and Temperature.
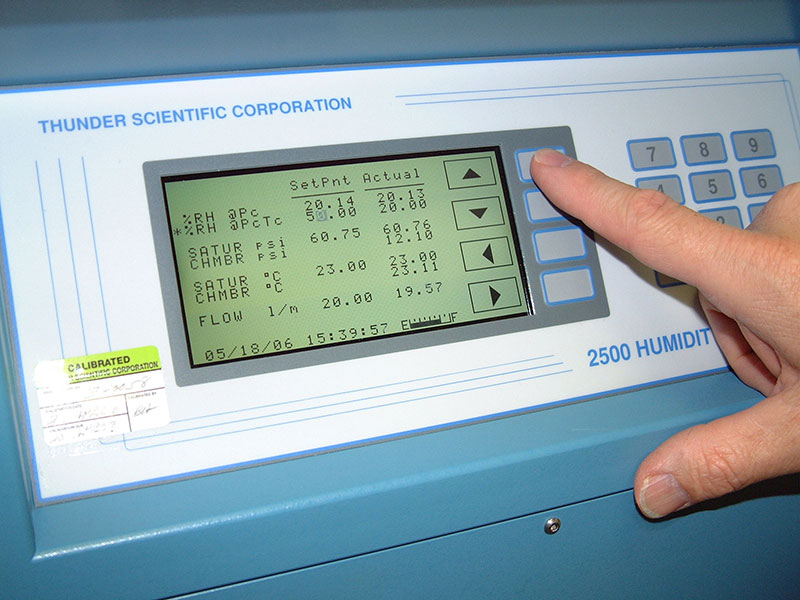
Figure 1.13
Change the set point on the 2500 to 50 %RH at 23 °C, allow 30 minutes for the system to stabilize at the new calibration point.
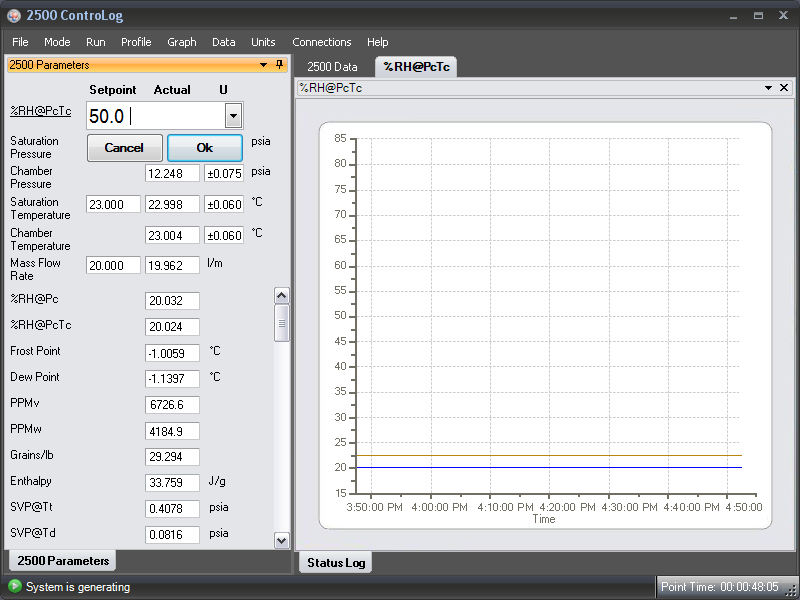
Figure 1.14
Click on the %RH Set point field of the Control Parameters window, the dialog box will appear, using the keyboard enter a set point of 50 then click OK, allow 30 minutes for the system to stabilize at the new calibration point.
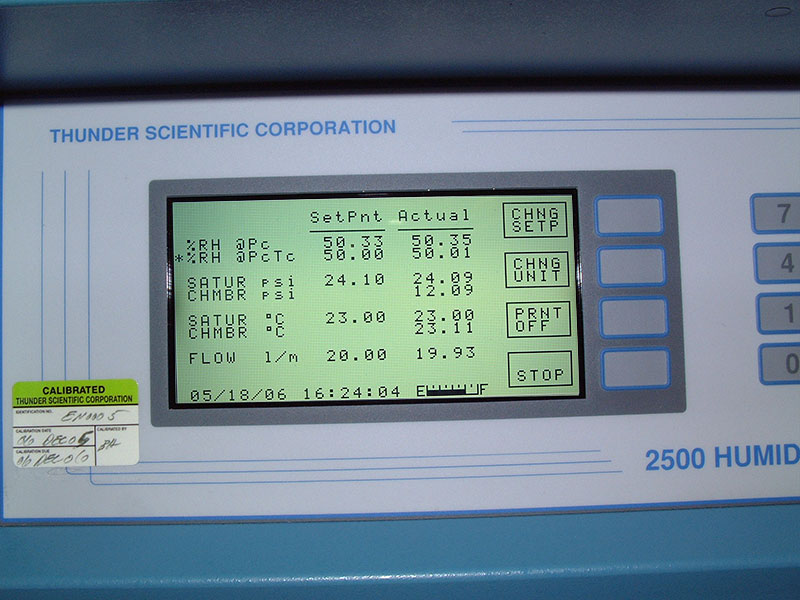
Figure 1.15
After 30 minutes we are ready to take a test point at 50 %RH at 23 °C. Record the readings from the 2500 and hand held hygrometer. Allow extra time if the DUT is still stabilizing at the test point.
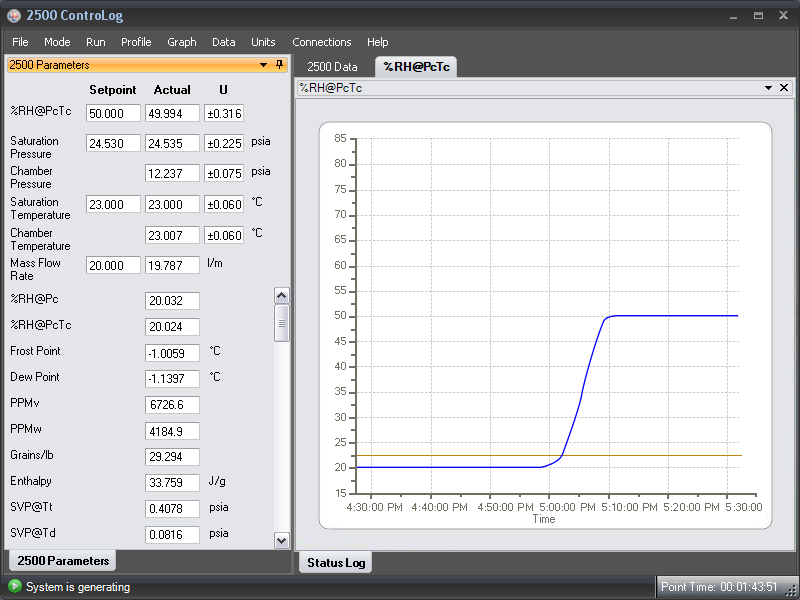
Figure 1.16
ControLog® Automation screen in the graph mode shows a stable set point at 50 %RH and 23 °C chamber temperature.
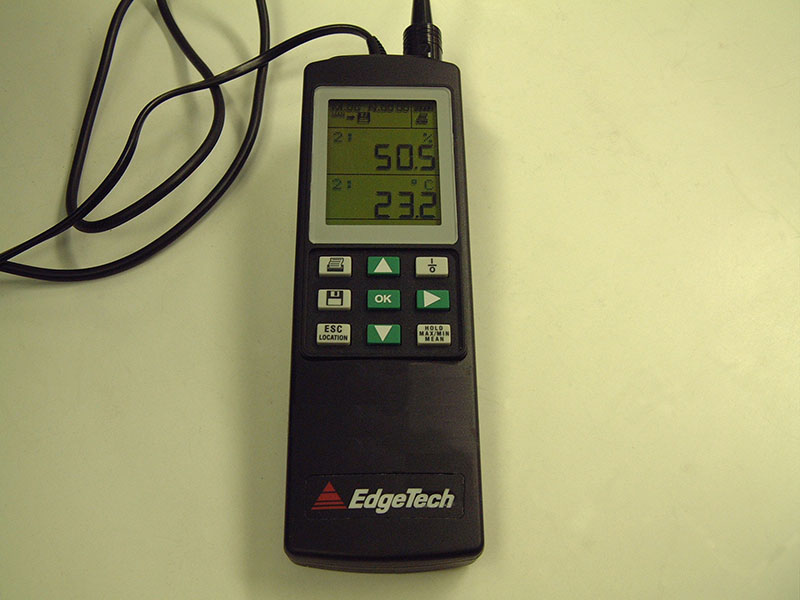
Figure 1.17
The displayed output values from the hand held hygrometer should be recorded for %RH and Temperature, allow extra time if the DUT is still stabilizing.
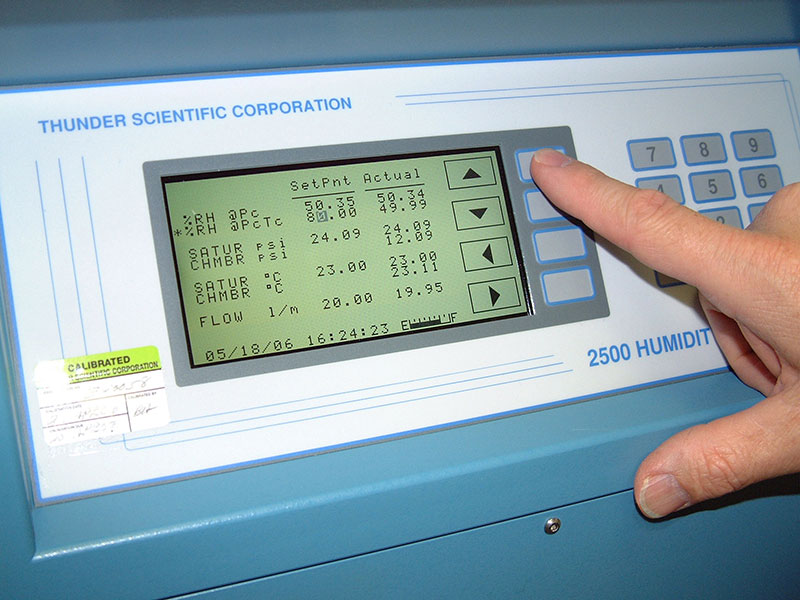
Figure 1.18
Change the set point on the 2500 to 80 %RH at 23 °C, allow 30 minutes for the system to stabilize at the new calibration point.
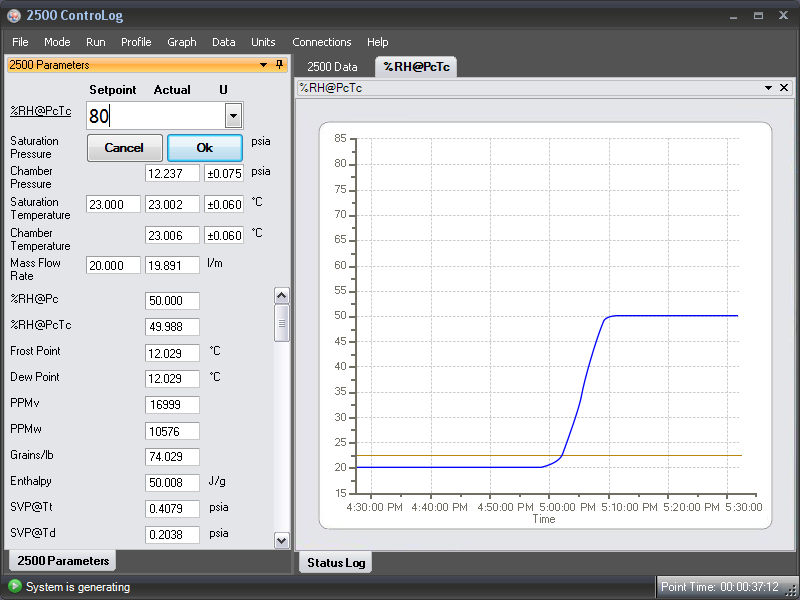
Figure 1.19
Click on the %RH Set point field of the Control Parameters window, the dialog box will appear, using the keyboard enter a set point of 80 then click OK, allow 30 minutes for the system to stabilize at the new calibration point.
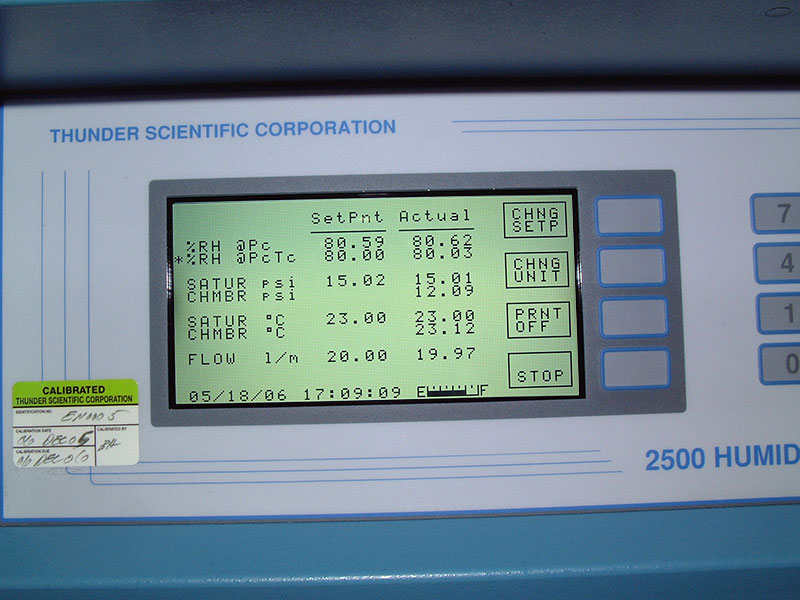
Figure 1.20
After 30 minutes we are ready to take a test point at 80 %RH at 23 °C. Record the readings from the 2500 and hand held hygrometer. Allow extra time if the DUT is still stabilizing at the test point.
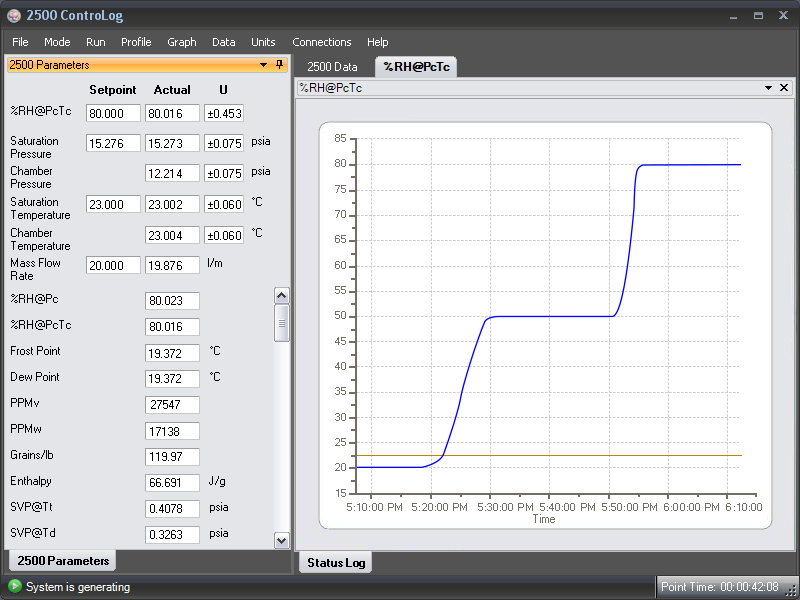
Figure 1.21
ControLog® Automation screen in the graph mode shows a stable set point at 80 %RH and 23 °C chamber temperature.
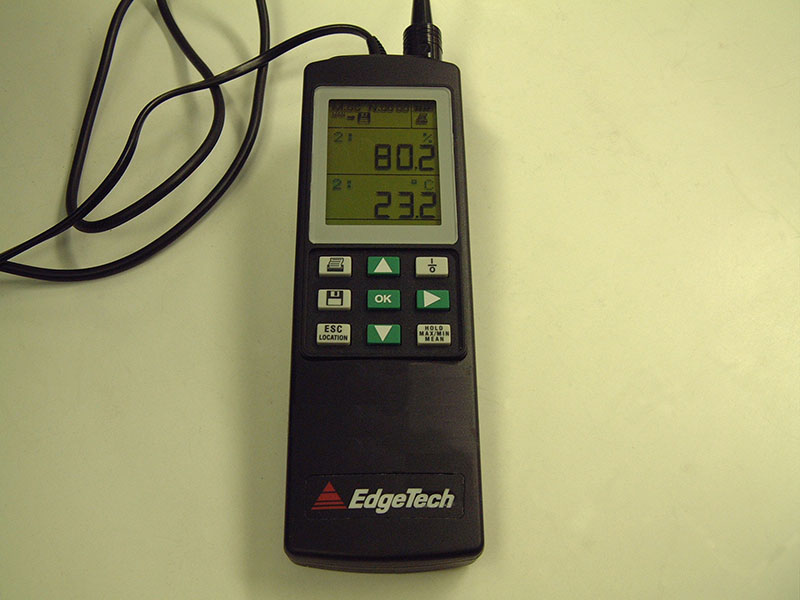
Figure 1.22
Record the final test point from the DUT display for %RH and Temperature.
Press Stop on the 2500 keyboard or, Select Shutdown from the Run menu, once the 2500 generator is shut down the system will prompt you to save the system data, which was acquired during this calibration
The initial as found calibration is complete. The filter element or screen that protects the humidity sensor element should be cleaned and inspected as per the manufacturers recommendation before calibration adjustment and testing the as left calibration of the hand held hygrometer.
The as left calibration should be performed at the same test temperature of 23 °C using the same 3 test points beginning at 20 %RH, test point interval will be 30 minutes.
Please contact support@thunderscientific.com should you have questions or problems using the procedure. We always appreciate your comments and feedback.
Thunder Calibration Support
Humidity & Temperature Chart Recorder Calibration
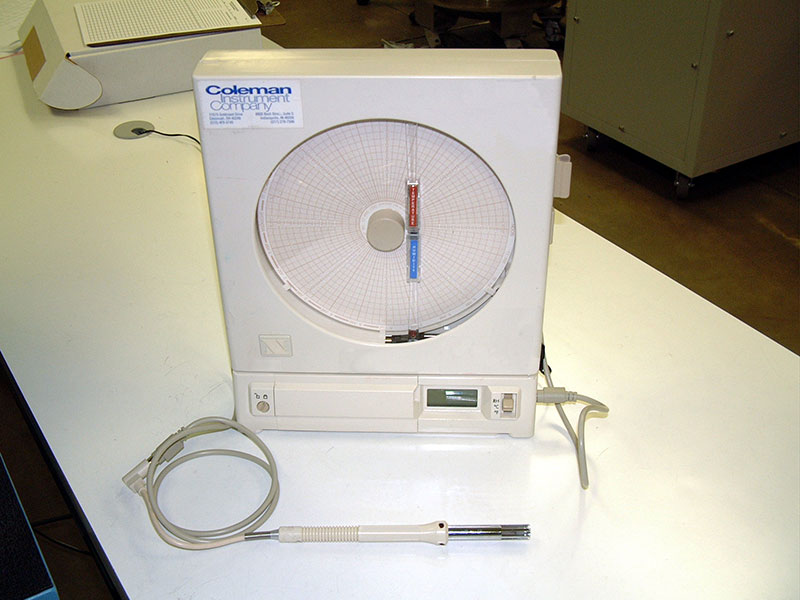
Figure 2.1
Calibration article (DUT) Humidity and temperature chart recorder, adjustable chart speed from 24-hour, 7 day or 30-day chart. Before calibration install a fresh 24-hour chart if available, select 24-hour chart speed.
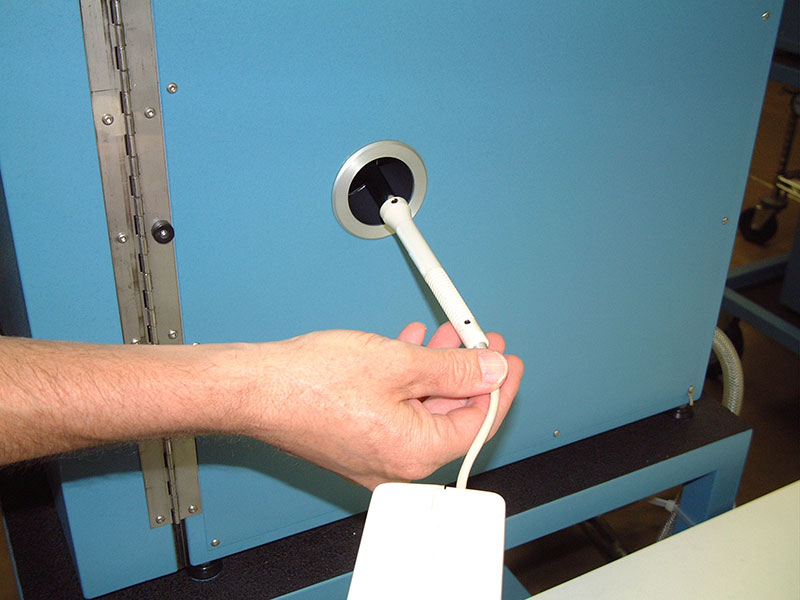
Figure 2.2
Connect the RH/Temp probe to an extension cable if available to allow access to the test chamber. Seal the opening with the white foam access plug. Connect power supply to the chart recorder.
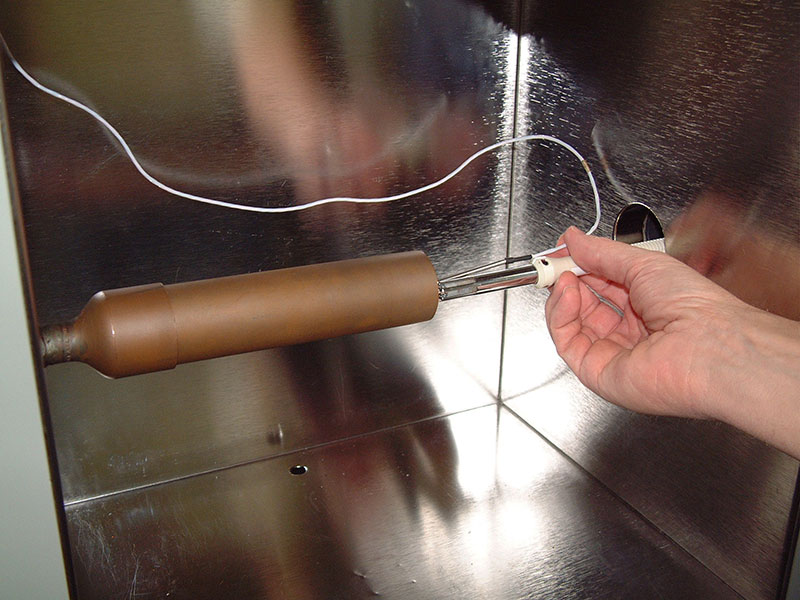
Figure 2.3
Position the RH/Temp probe into the manifold fixture with the 2500 chamber temperature sensor. Close the 2500 chamber door.
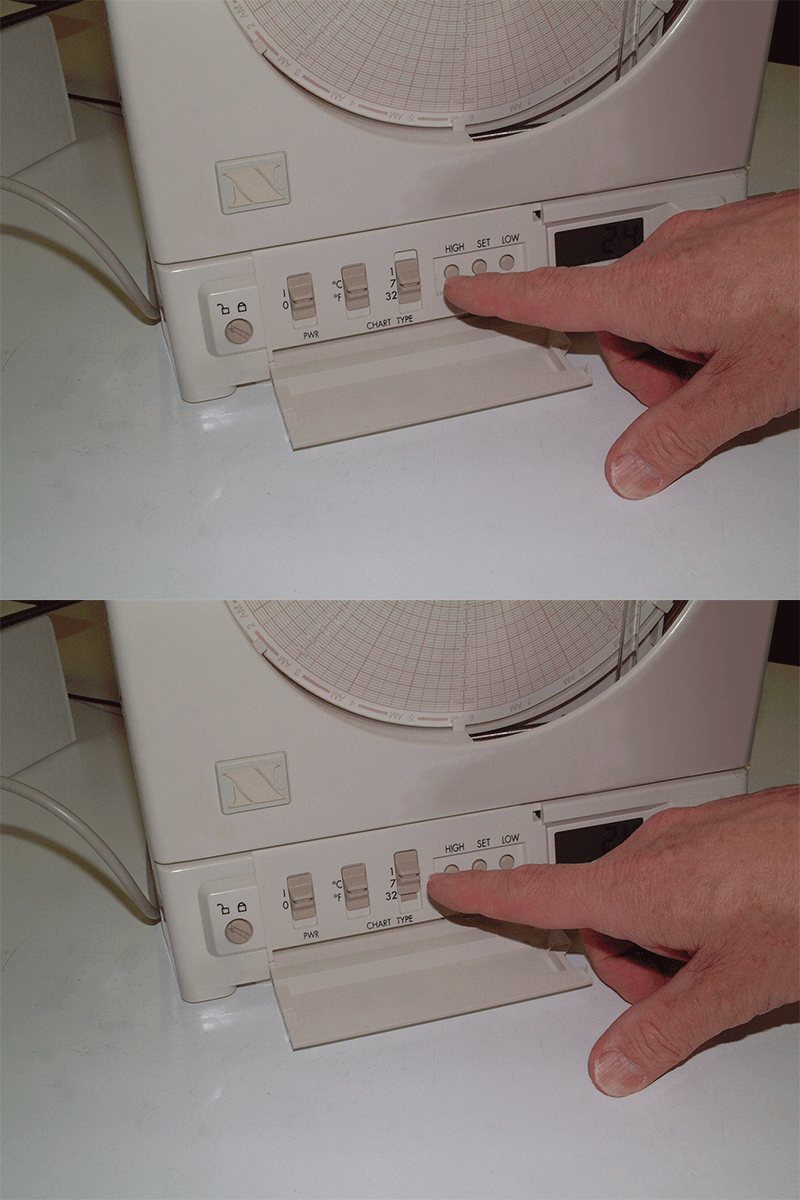
Figure 2.4
Adjust the chart recorder chart speed to 1 day or 24-hour chart speed if adjustable. Apply power to the chart recorder.
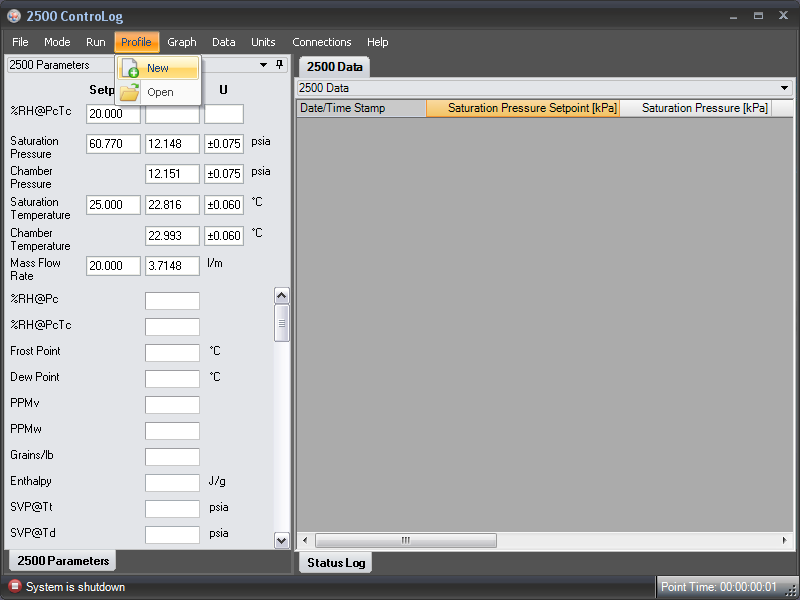
Figure 2.5
Review the ControLog® Manual if you are not familiar with this software. Open ControLog® software; under the Profile menu select New Profile.
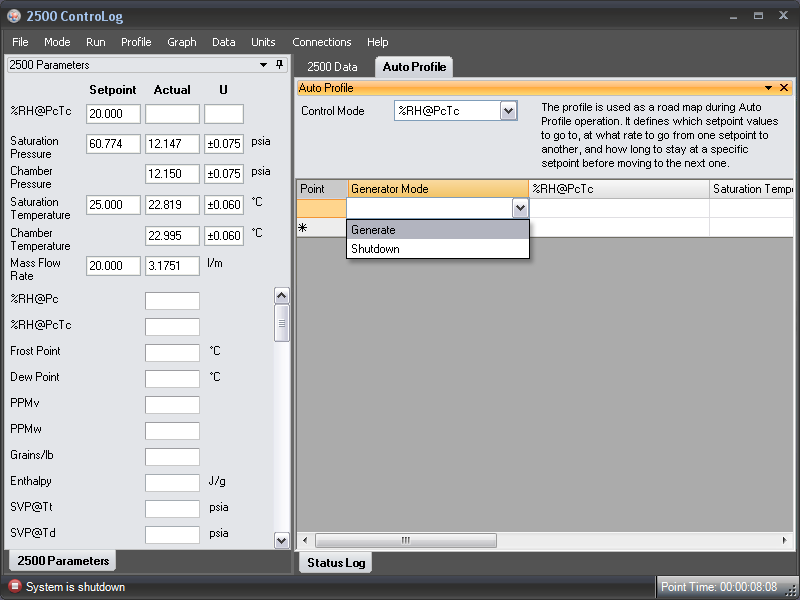
Figure 2.6
Click once on the cell of any value needing a change. It is usually best to start at the upper leftmost cell. For this automatic profile calibration we will use 20.0 %RH as the first test point.
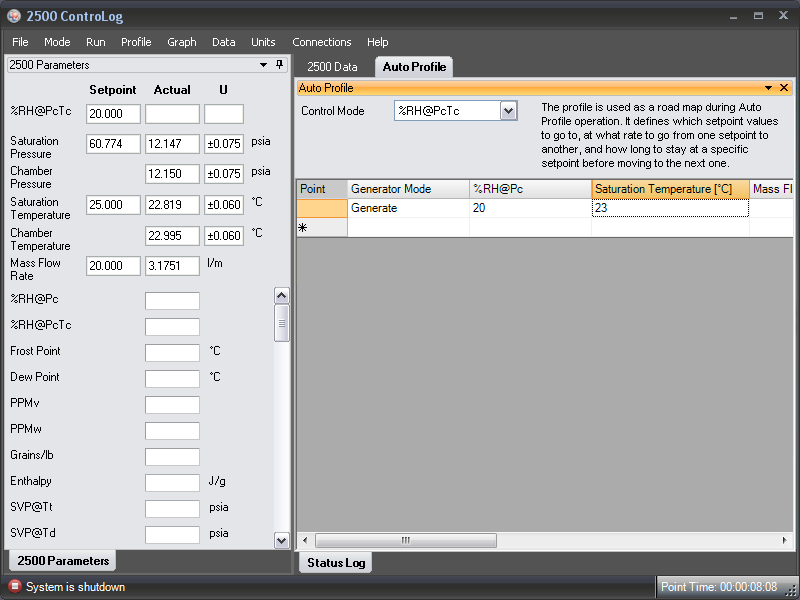
Figure 2.7
The test points selected will be 20%, 50% & 80% returning to 20 %RH, the test temperature has been entered as 23.0 °C, a flow rate of 20 SLPM, you should always run the 2500 at the maximum flow rate of 20 SLPM for best uniformity of the test chamber. The ramp time entered is 0; we want the 2500 to reach the set point as fast as possible. The soak time for the test point will be 2 hours or 120 minutes. This time can be reduced based on the response time of the DUT. We have selected NO for the assured soak conditions; the 2500 will stabilize as close as possible to the test point as selected.
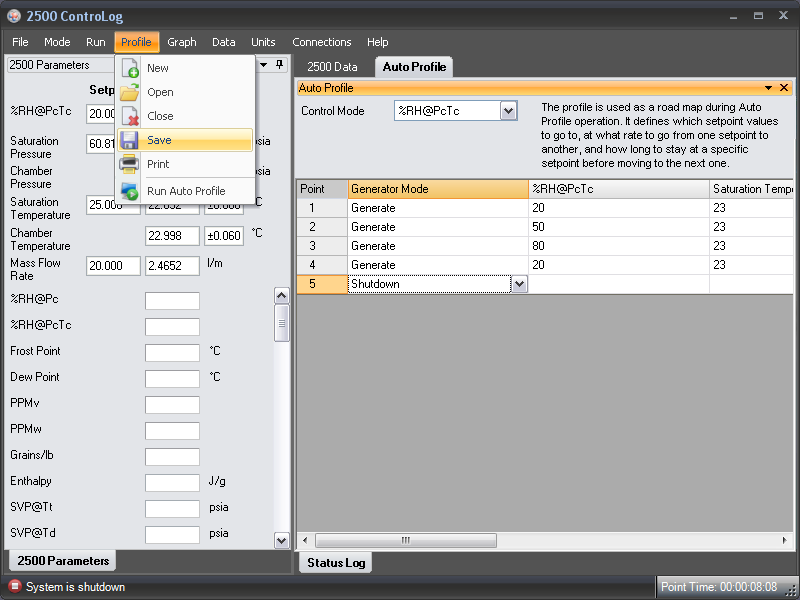
Figure 2.8
Select Save Profile under the Profile menu. The profile as designed can be reused or revised for similar auto profile calibrations.
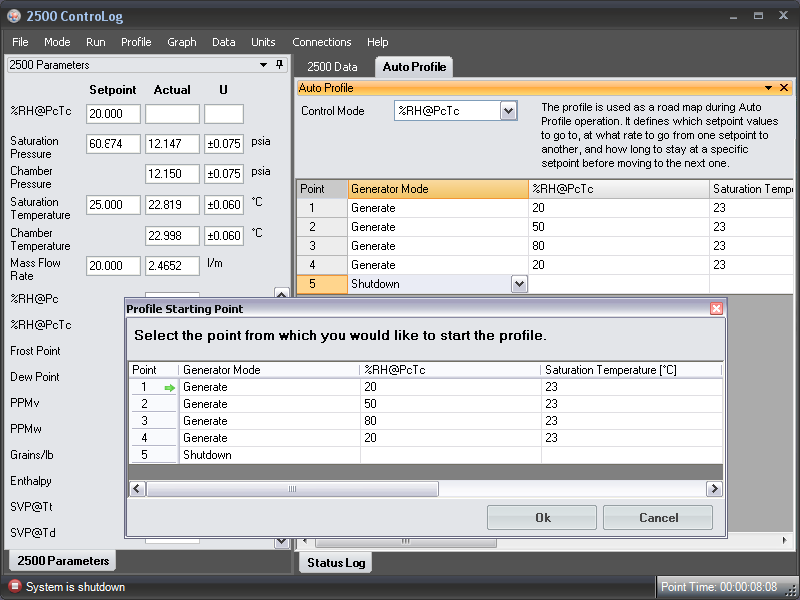
Figure 2.9
Select Auto Profile under the Run menu from the tool bar, the Auto Profile insert will be displayed with the first set point highlighted, click OK the 2500 will start at the first test point of 20.0 %RH at a test temperature of 23 °C.
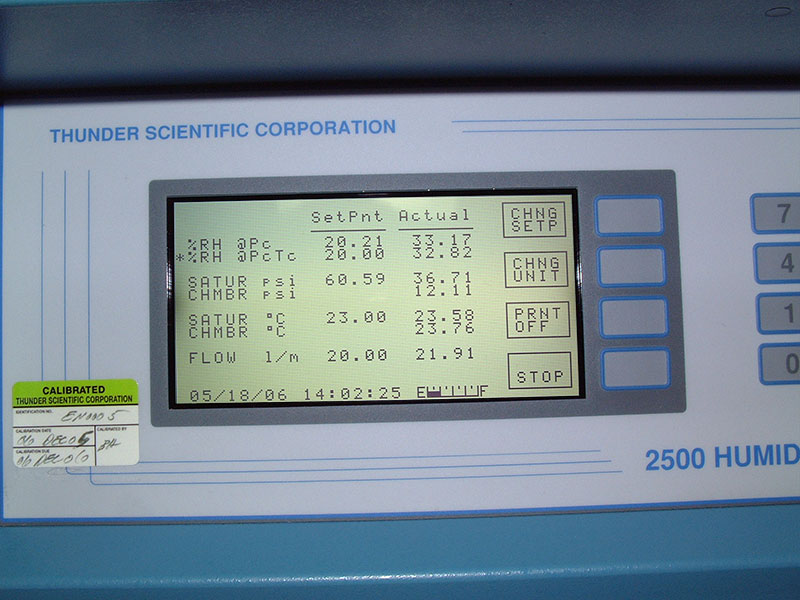
Figure 2.10
The 2500 run screen will display the set points as programmed from ControLog® Auto Profile.
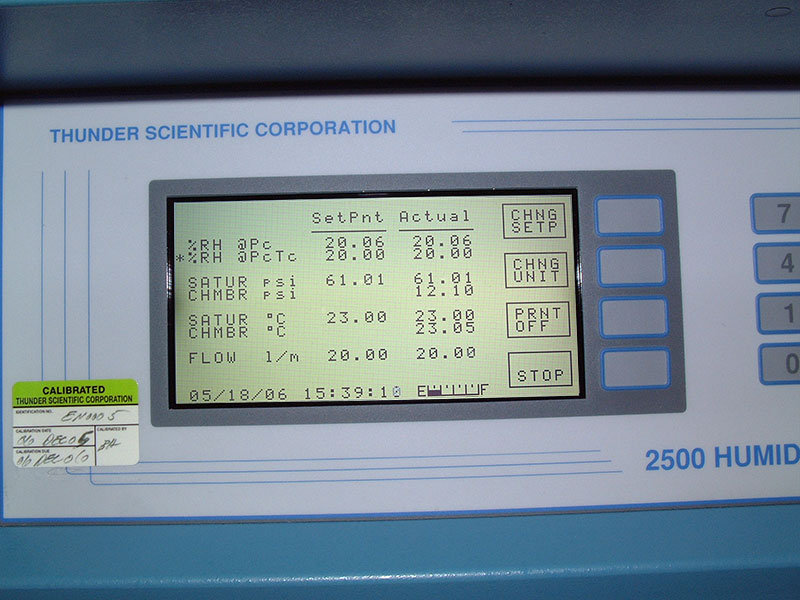
Figure 2.11
The 2500 display screen after 90 minutes displays a stable reading at 20 %RH at the test temperature of 23 °C.
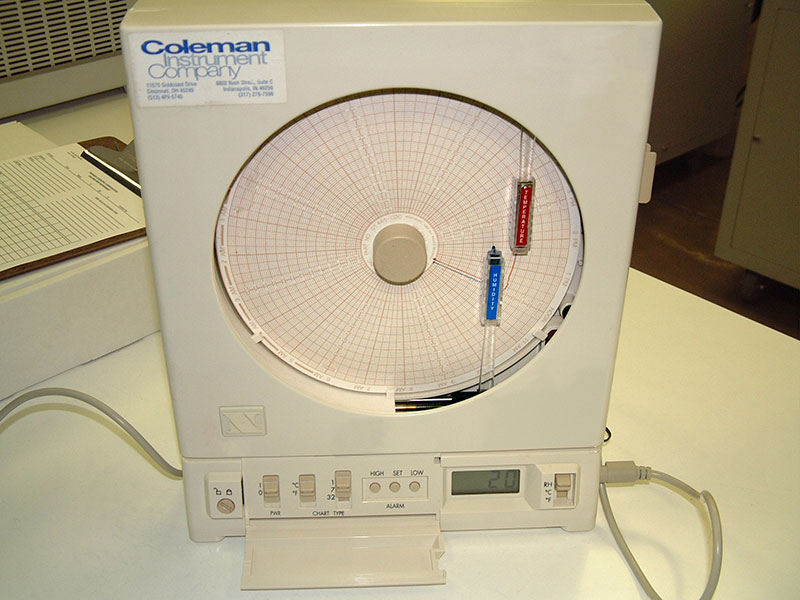
Figure 2.12
The DUT RH/Temp recorder is shown with a displayed output of 20 at 20.0 %RH, you should monitor the calibration to be sure the displayed output agrees with the trace on the chart record.
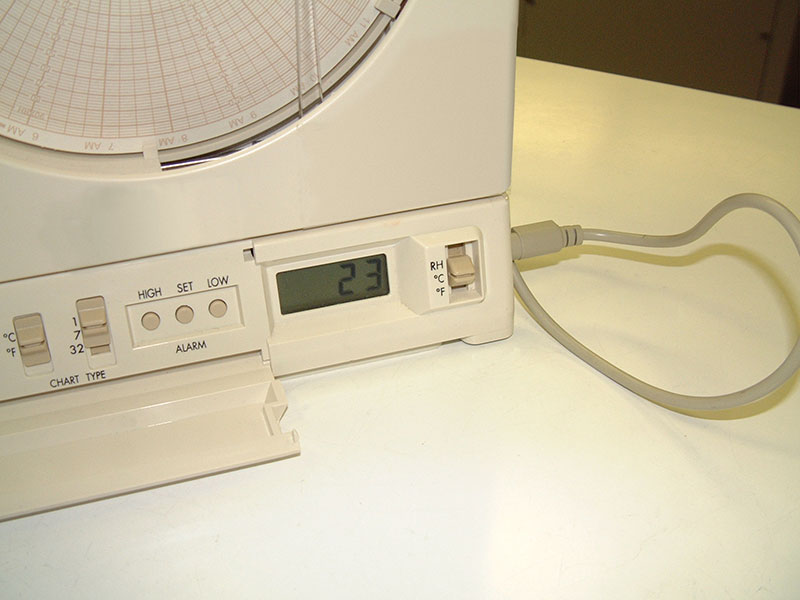
Figure 2.13
The DUT RH/Temp recorder is shown with the displayed output for temperature at test temp of 23 °C.
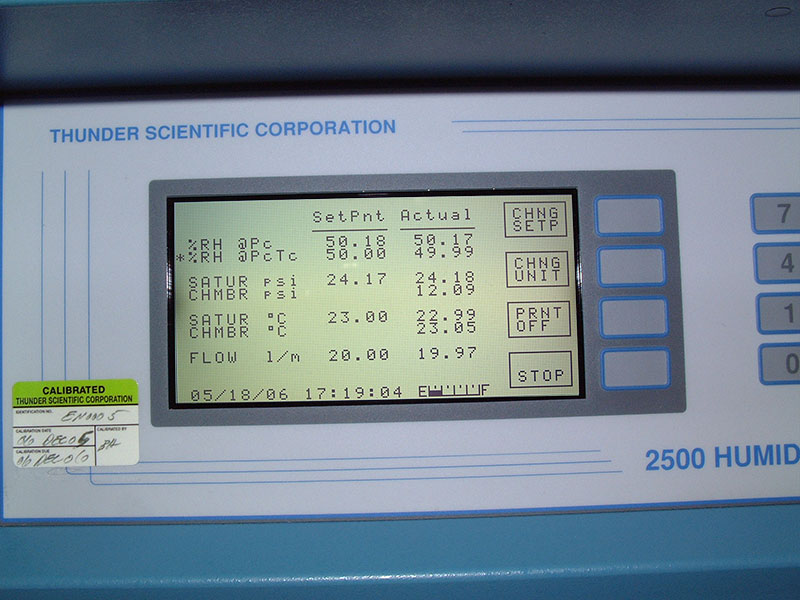
Figure 2.14
The 2500 display screen is shown with the set point change to 50 %RH after 2 hours.
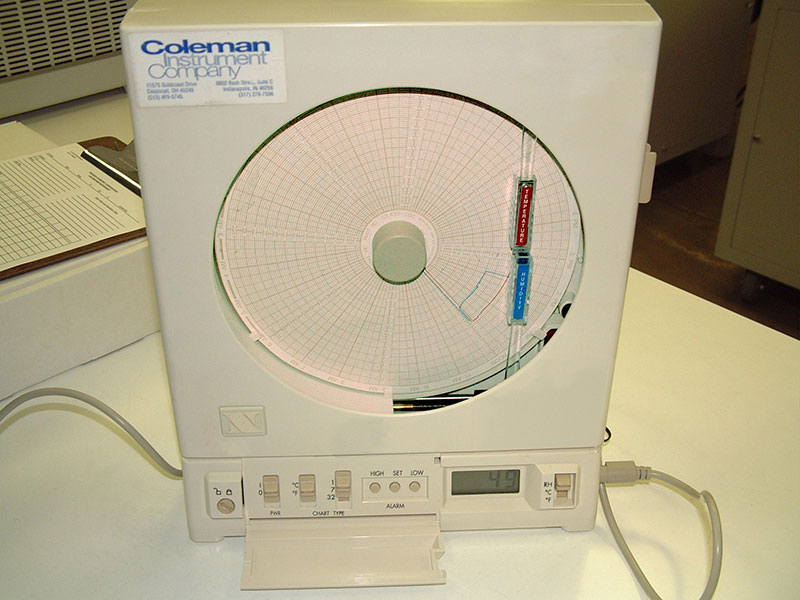
Figure 2.15
The DUT RH/Temp recorder is shown with the displayed output of 49% at the 50.0 %RH set point.
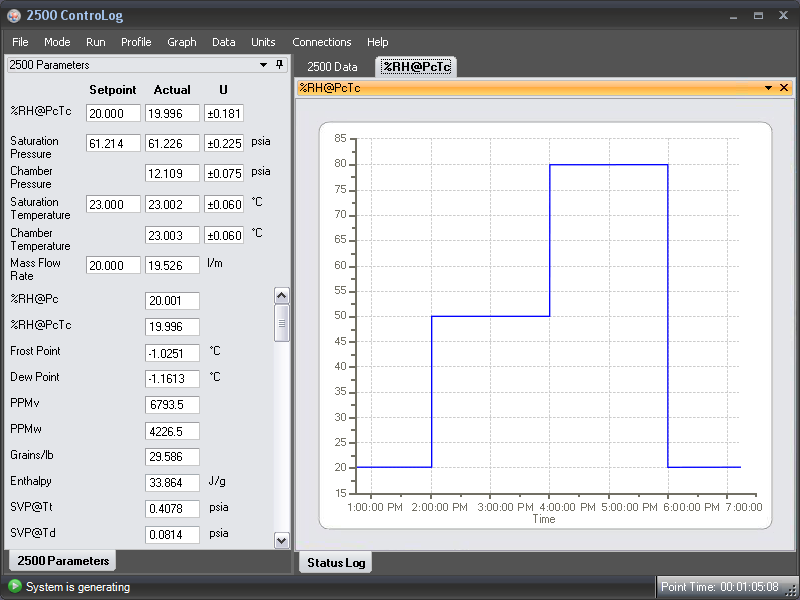
Figure 2.16
After 8 hours of Auto profile calibration the ControLog® graph displays the 4 point profile from 20% RH to 80% RH with a final point at 20% RH. The ControLog® graph confirms the stability and time duration of the Auto profile. The file should be saved with appropriate serial number or file name for the RH/Temp recorder.
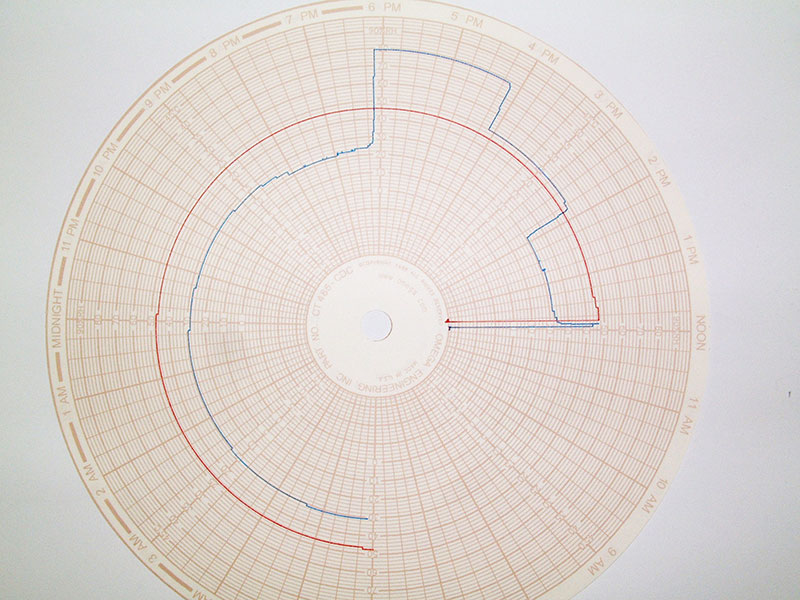
Figure 2.17
The RH/Temp chart record can be compared to the 2500 ControLog® data for error and test stability, the calibration as performed on this instrument was within the manufacturers tolerance. The chart record as prepared should be scanned or photographed for file history on this instrument.
Please contact support@thunderscientific.com should you have questions or problems using the procedure. We always appreciate your comments and feedback.
Thunder Calibration Support
Humidity & Temperature Data Logger Calibration
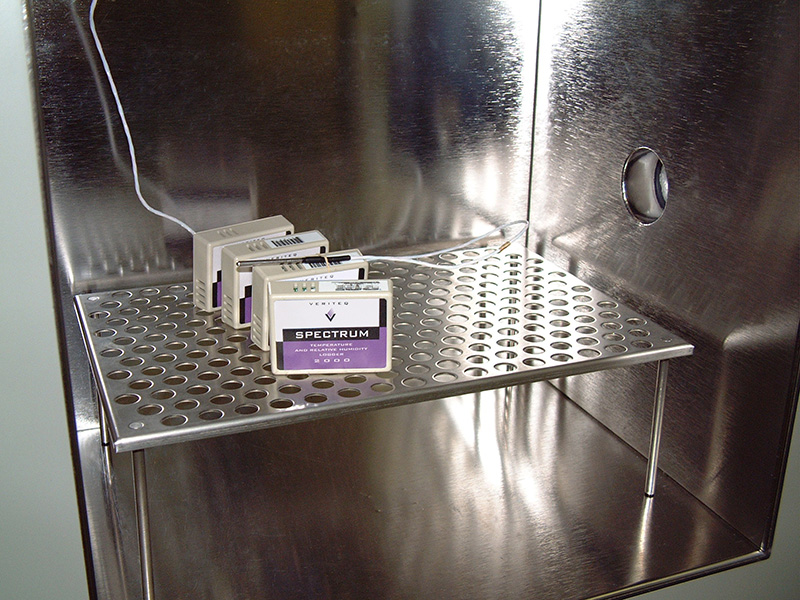
Figure 3.1
Calibration article (DUT) Humidity and Temperature Data Logger positioned in the chamber using the chamber instrument shelf accessory. Locate the 2500 chamber temperature sensor (RTD3) and position it in close proximity with the RH/Temp loggers. Close the 2500 chamber door.
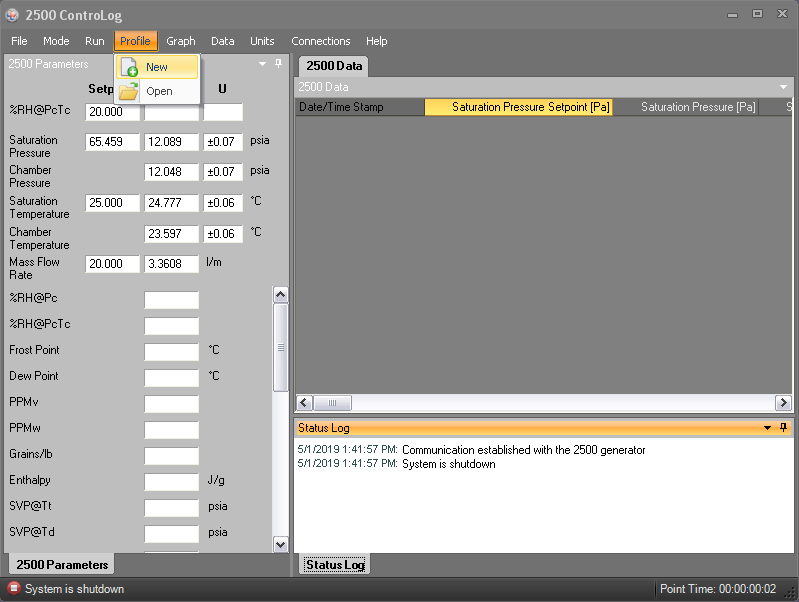
Figure 3.2
Open the 2500 ControLog® software; under the Profile menu select New.
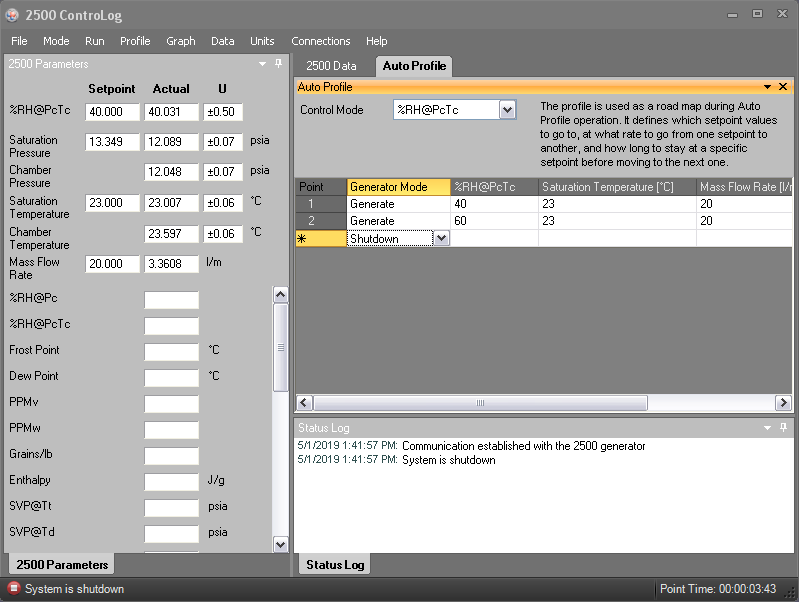
Figure 3.3
Enter these profile test points 40% & 60% RH, the test temperature will be entered as 23.0 °C, and a flow rate of 20 SLPM, you should always run the 2500 at the maximum flow rate of 20 SLPM for best uniformity of the test chamber. The ramp time entered is 0; we want the 2500 to reach the set point as fast as possible. The soak time for each test point will be 8 hours. This time can be reduced based on the response time of the DUT. We have selected NO for the assured soak conditions; the 2500 will stabilize as close as possible to the test point as selected.
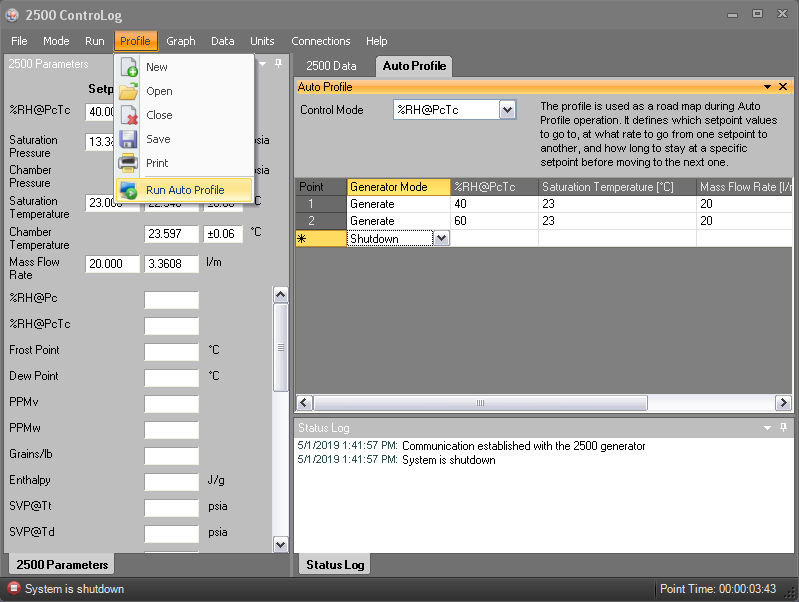
Figure 3.4
Select Run Auto Profile under the Profile menu from the tool bar.
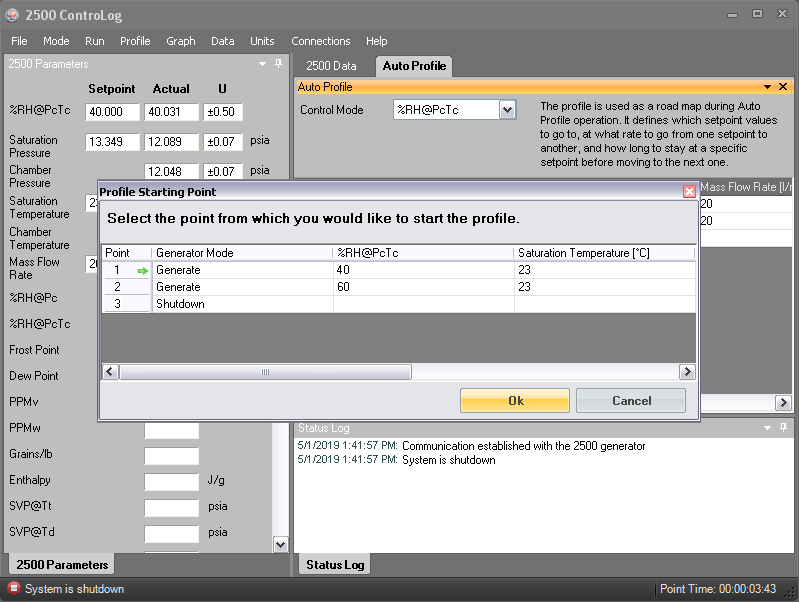
Figure 3.5
The Profile Starting Point screen will be displayed with the first set point highlighted with a green arrow. As stated on this dialog box, you can select any of the test points as your starting point. Click the OK button and the 2500 will start at the first test point of 40.0% RH at a test temperature of 23 °C
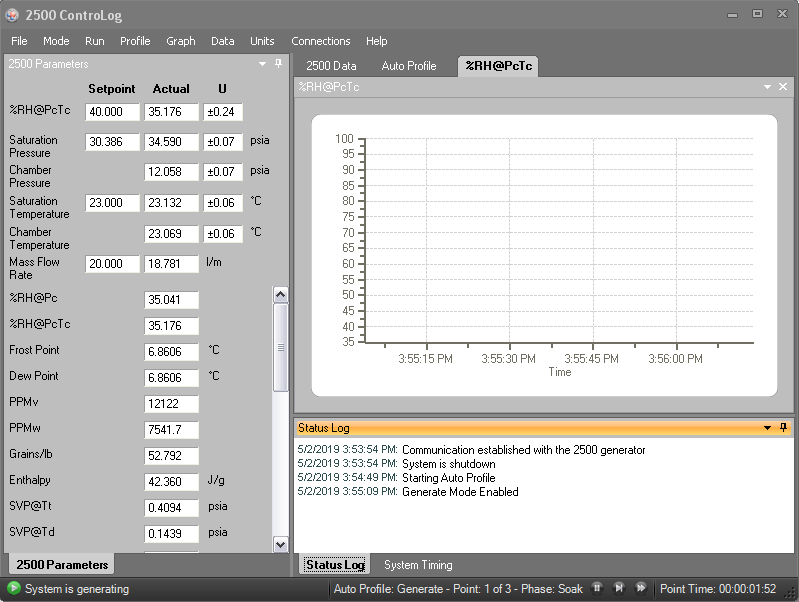
Figure 3.6
Note the set point of 40.0 %RH and a test temperature of 23 °C are displayed on the 2500 Parameters tab.
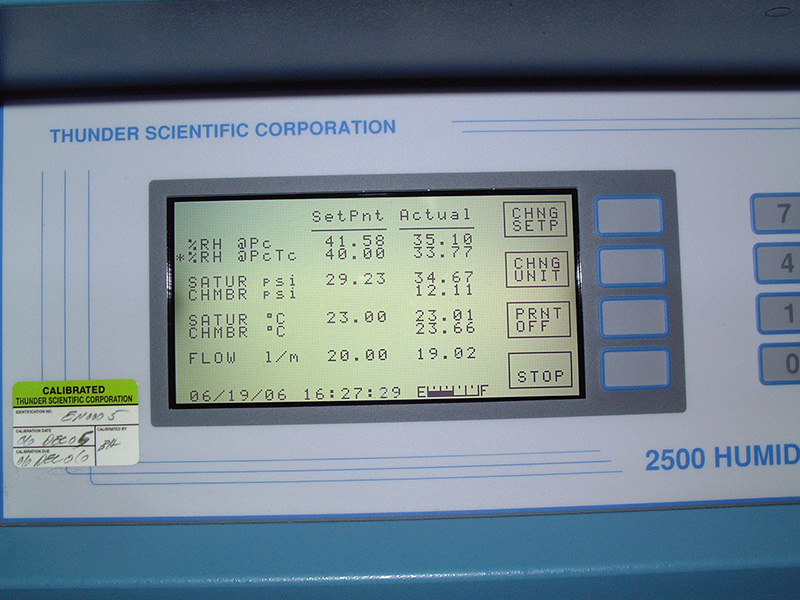
Figure 3.7
The 2500 run screen will display the set points as programmed from the ControLog® Auto Profile.
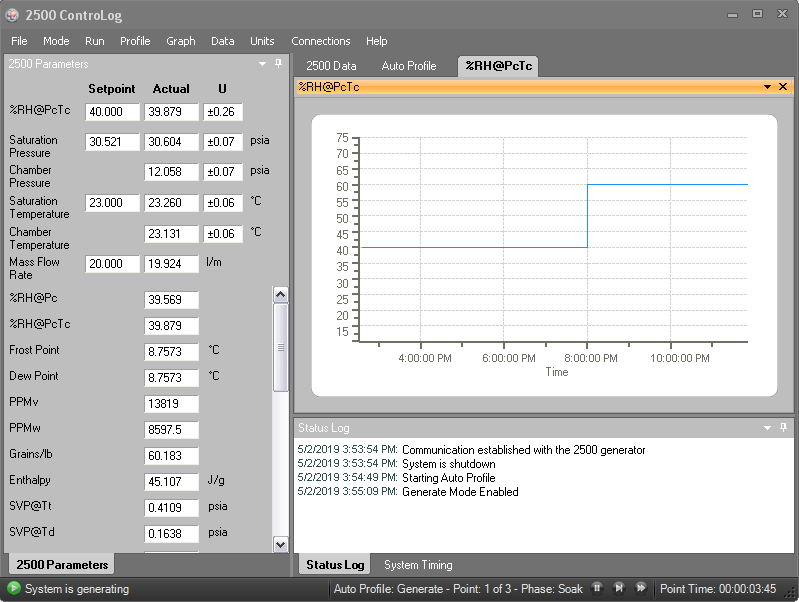
Figure 3.8
After 16 hours of Auto profile calibration the ControLog® graph displays the 2 point profile from 40% RH to 60% RH. The ControLog® graph confirms the stability and time duration of the Auto profile. The file should be saved with appropriate serial number or file name for the RH/Temp loggers.
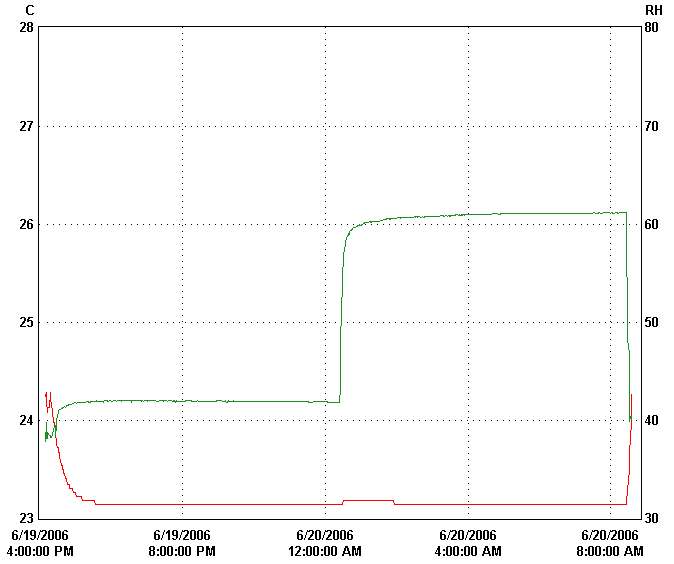
Figure 3.9
Figure 3.9 shows the data collected from the Veriteq data logger program.
Please contact support@thunderscientific.com should you have questions or problems using the procedure. We always appreciate your comments and feedback.
Thunder Calibration Support
Calibration Set-Up RH/Temp Transmitters
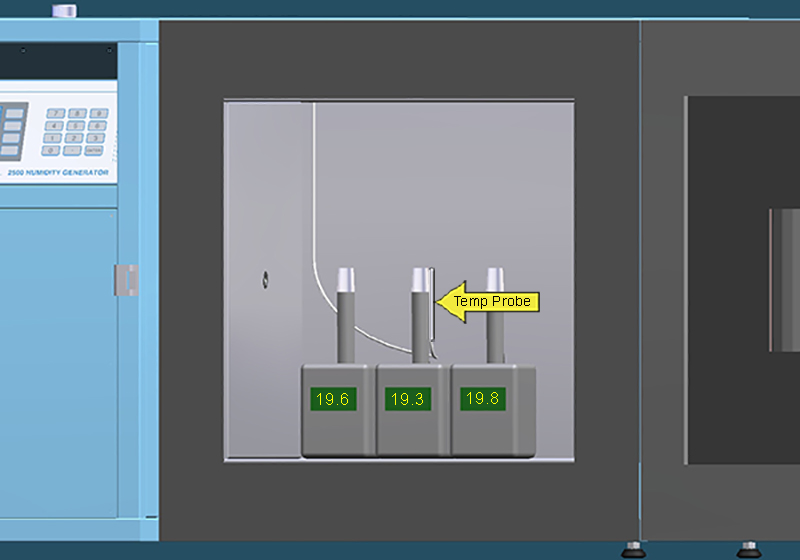
Figure 4.1
Multiple sensors in the test chamber will sometimes exhibit self heating due to the embedded electronics in the transmitter housing. It is important to locate the chamber temp probe as close to the RH/Temp probe as possible. Observe inter-comparison of temperature output between sensors.
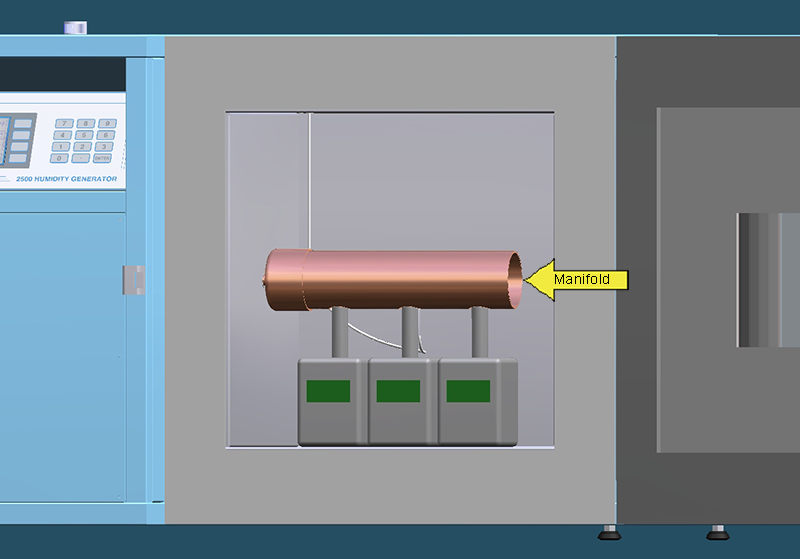
Figure 4.2
A manifold fixture is a simple solution to duct the in coming humidity test value over the probes during calibration. The manifold solution will improve temperature uniformity between probes. Locate the chamber temperature probe inside the manifold during calibration.
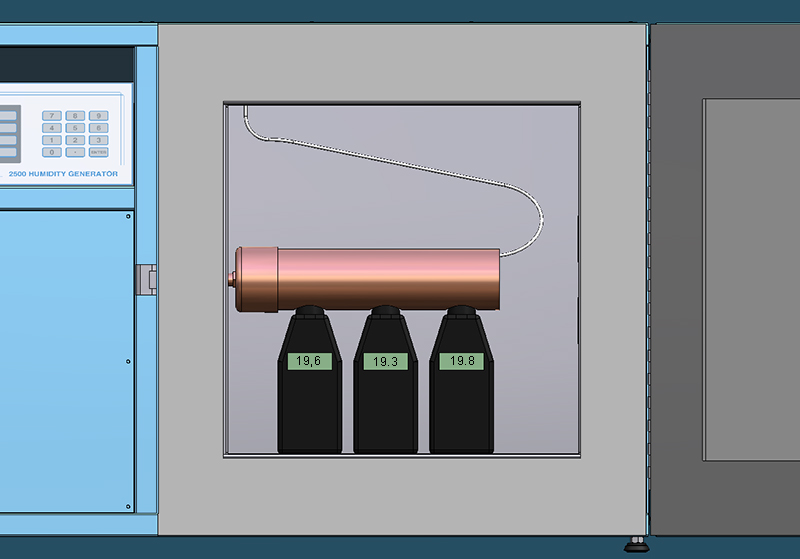
Figure 4.3
A similar manifold fixture can be used for calibration of small hand-held devices where the humidity value is displayed on the device. It is possible to open the door for brief periods for adjustment of the device during calibration.
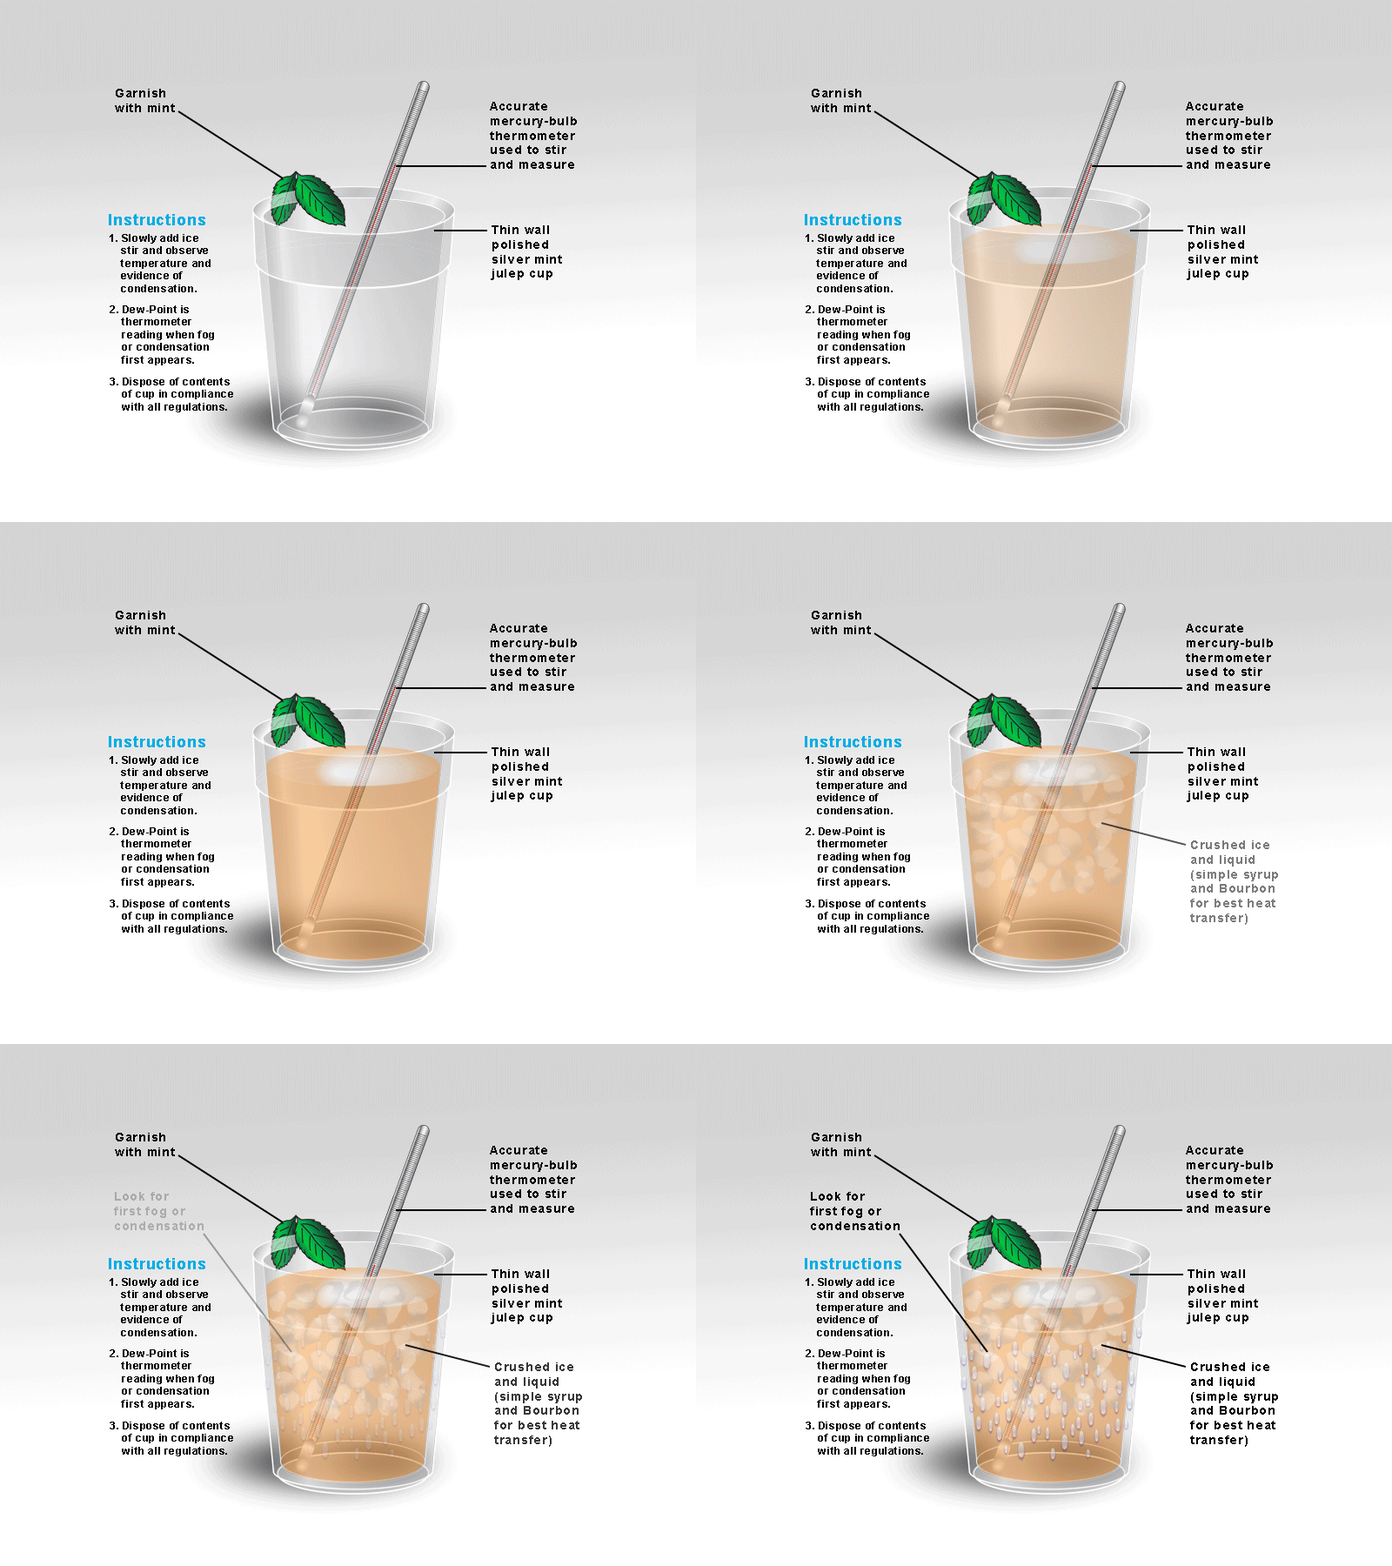
Figure 4.4
What is Dew Point?
A dew-point hygrometer utilizes a temperature-controlled, highly polished observable surface. In the instrument’s simplest form, crushed ice is slowly added to a liquid in a thin-walled silver container such as a mint julep cup. An accurate mercury bulb thermometer is used to constantly stir the liquid in the cup. When the first sign of condensation (dew) is observed on the outside of the cup, the temperature of the liquid in the cup is read as the dew-point temperature. This method requires that the temperature of the outside surface of the silver cup and the temperature of the liquid in the cup be essentially the same. In actual practice, the temperature of the liquid in the cup will be slightly lower than the outside surface temperature of the cup.
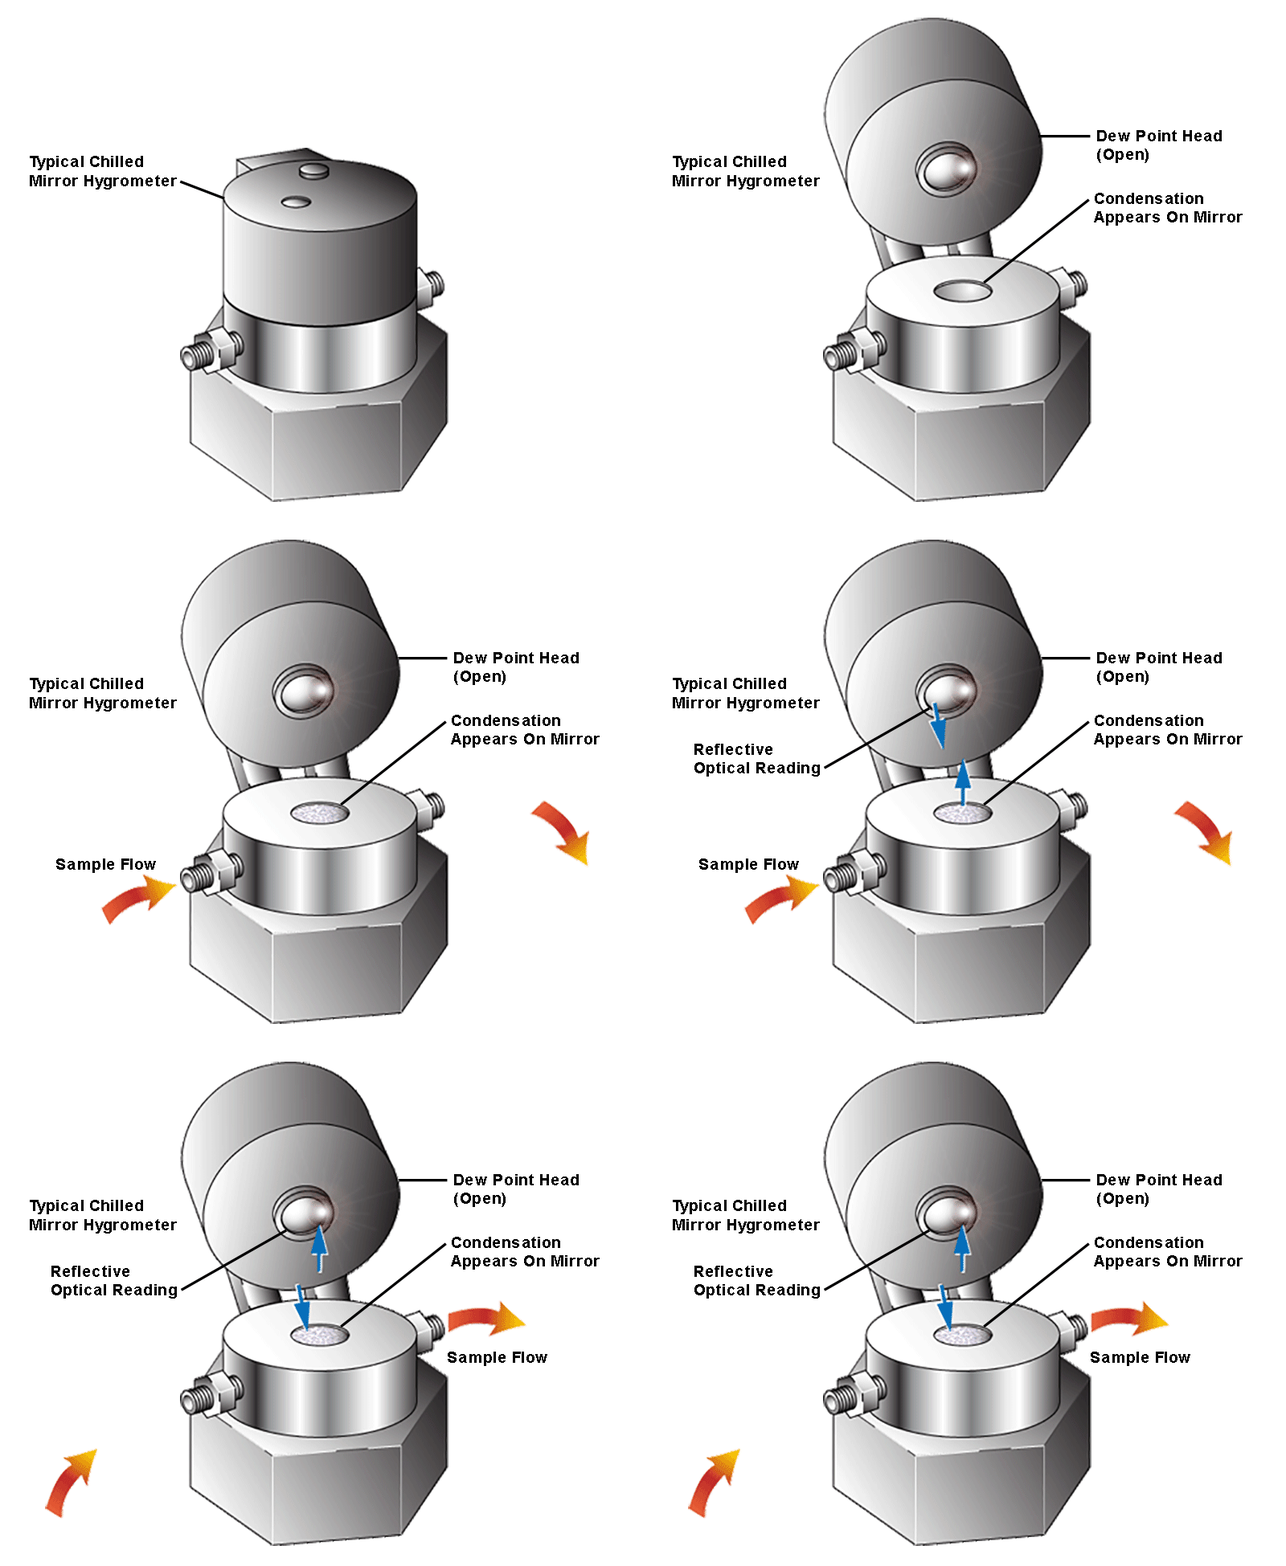
Figure 4.5
In its most fundamental form, dew point is detected by cooling a reflective condensation surface (mirror) until water begins to condense, and by detecting condensed fine water droplets optically with an electro-optic detection system. The signal is fed into an electronic feed back control system to control the mirror temperature, which maintains a certain thickness of dew at all times.
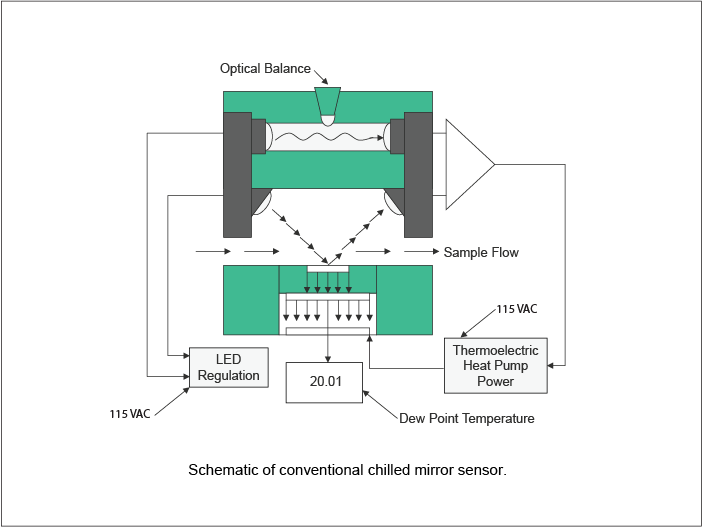
Figure 4.6
This is a graphical representation of the flow of a chilled mirror sensor.
Please contact support@thunderscientific.com should you have questions or problems using the procedure. We always appreciate your comments and feedback.
Thunder Calibration Support
Chilled Mirror Hygrometer Calibration
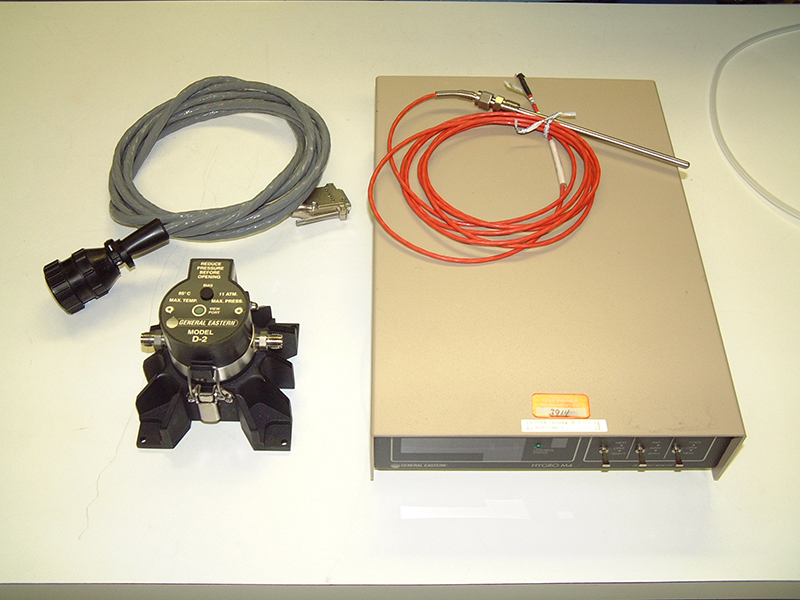
Figure 5.1
A typical dewpoint hygrometer with air temp sensor (AT) Series Hygro M4 is a general purpose optical condensation hygrometer used for industrial and laboratory applications.
Optical condensation hygrometry is a precise technique for determining the water vapor content in gases by measuring dew or frost temperatures. Optical condensation hygrometry works on the chilled-mirror principle. A metallic mirror surface is cooled until it reaches a temperature at which condensation begins to form on it. The dew layer is optically detected and the mirror is held at that temperature. The mirror temperature, measured with a platinum resistance thermometer is an accurate indicator of the dew or frost point.
Typical accuracy for this hygrometer is specified at ±0.2 °C DP.
The calibration of the dewpoint hygrometer as described and illustrated, will be a 3 point sample calibration at 20, 50, & 80% RH at a test temperature of 25 °C.
Dew point values will be calculated using HumiCalc Humidity Conversion software.
Figure 5.2
It is always a good idea to review the operations manual for the instrument you will be calibrating.
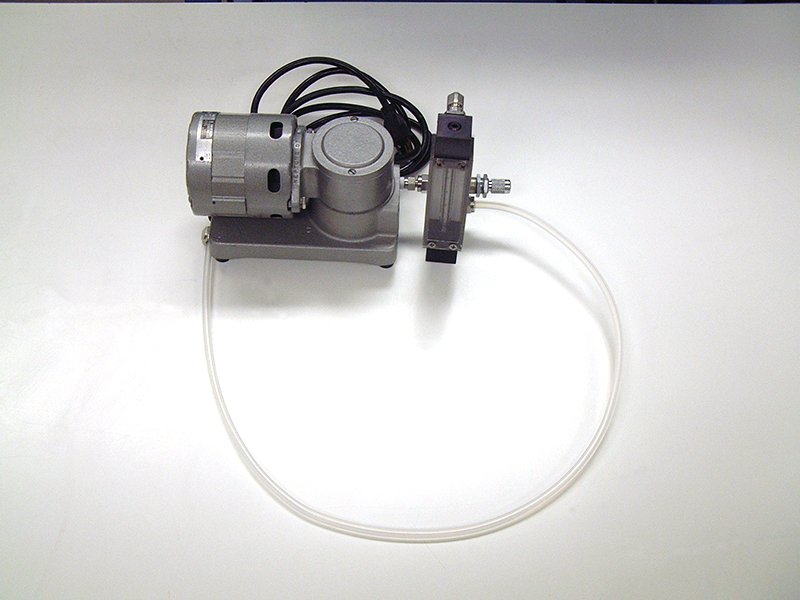
Figure 5.3
You will need a sample air pump as illustrated. The air pump is used for drawing a sample from the Model 2500 test chamber and flowing this sample over the dewpoint mirror. It is important to have adequate flow rate over the dewpoint mirror. A flow rate of less than 1 SLPM is specified by the manufacturer. To much flow over the mirror will cause instability and accuracy problems.
Please refer to Fig 5.43 & 5.44 for an alternate method of providing metered flow over the dew point mirror.
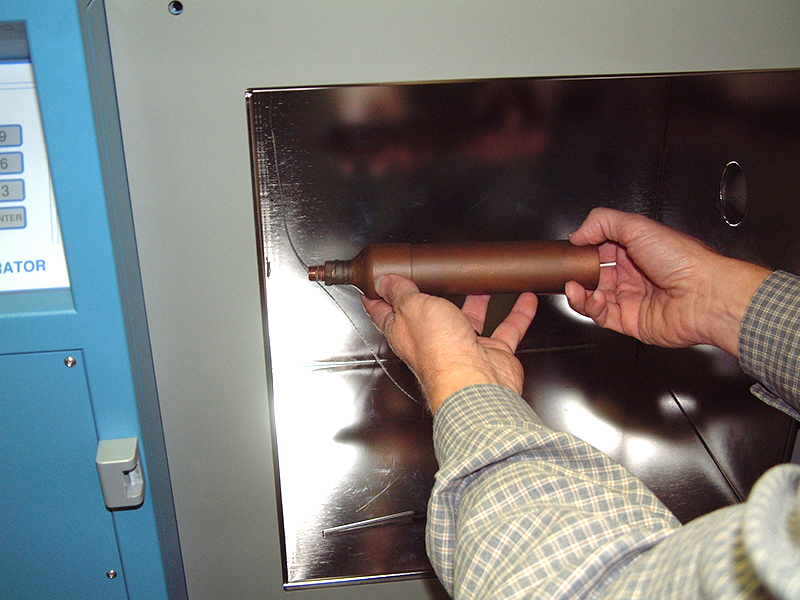
Figure 5.4
Install the manifold accessory in the test chamber of the 2500. The manifold will thread into the chamber inlet port with a ¼ inch NPT male thread. It's not necessary to seal or tighten the manifold tight. The manifold accessory will reduce the calibration test time.
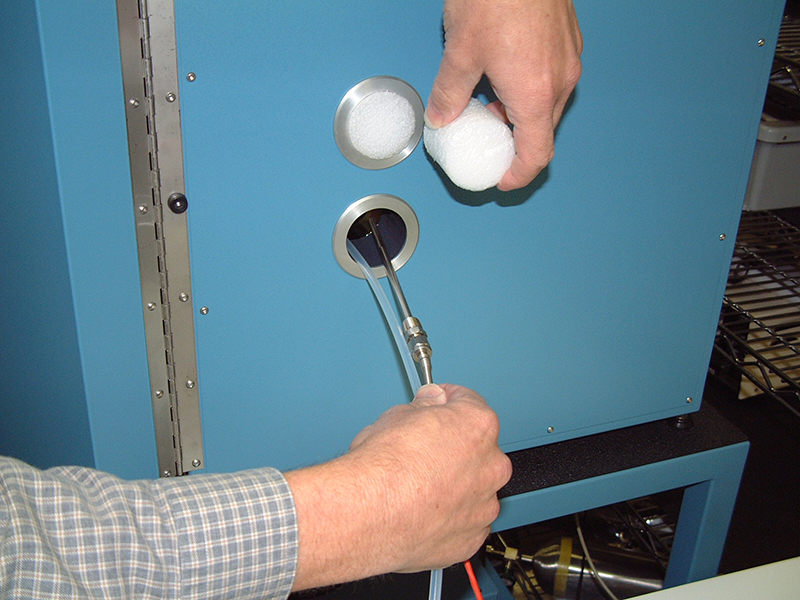
Figure 5.5
Remove the 2500 foam access port plug and guide the air temp probe and sample tube into the test chamber.
The tubing used for the inlet and outlet from the sample air pump should be a clean ¼ inch Teflon tube. Note: It is not a good idea to use rubber or plastic tubing such as PVC because of the hygroscopic nature of the material.
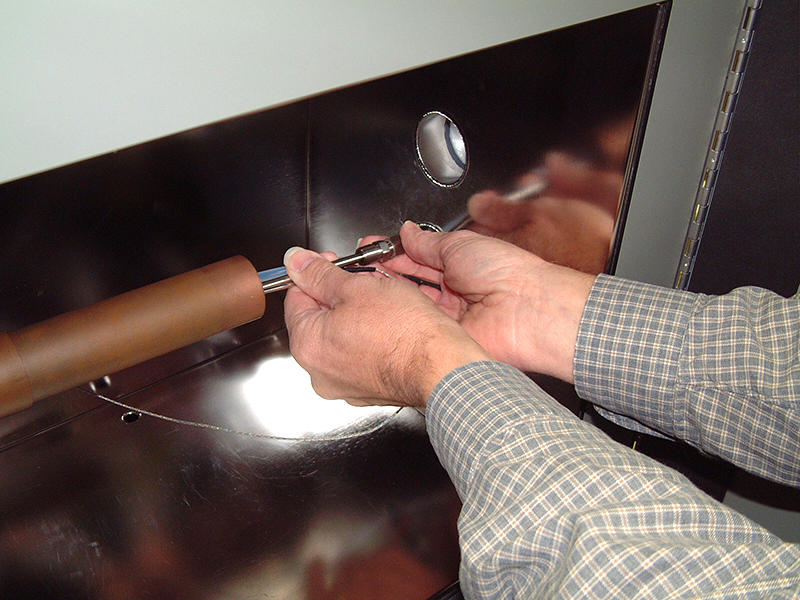
Figure 5.6
Bundle the sample tube, air temp probe and the chamber temp sensor from the 2500 together in the manifold as illustrated. It is important that the air temp probe from the hygrometer is positioned with the 2500 chamber temp sensor. (RTD3)
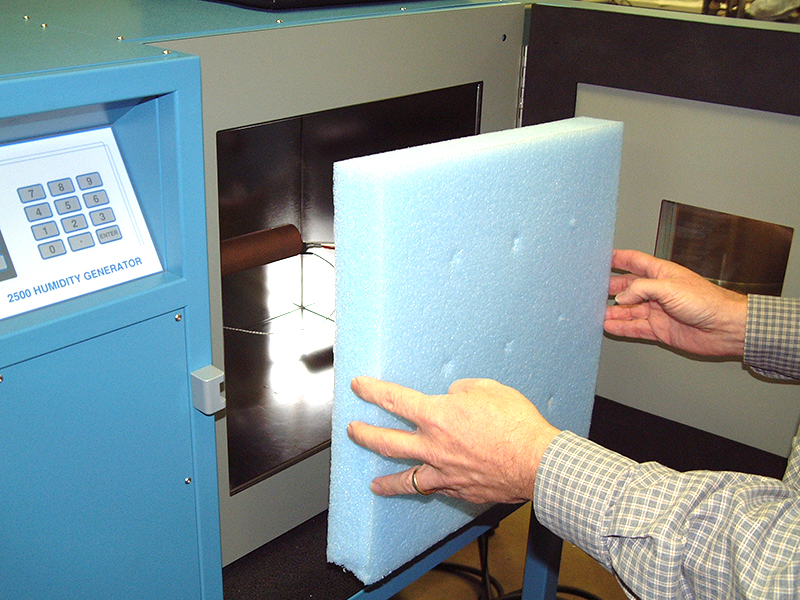
Figure 5.7
Install the 2 inch foam insulation piece in the 2500 chamber opening behind the door. Additional insulation will help reduce calibration test time.
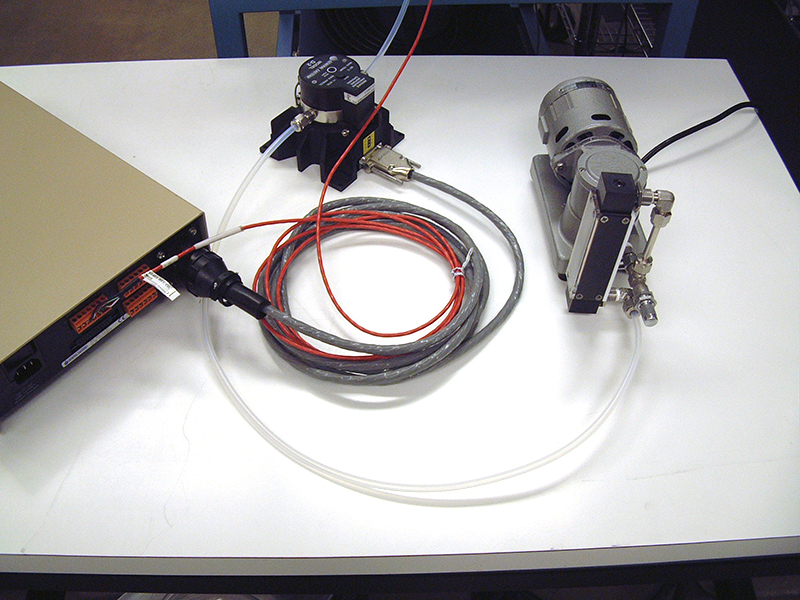
Figure 5.8
The sample tube from the 2500 test chamber is connected to one side of the dew point mirror using ¼" Swagelok fitting. The outlet of the dewpoint mirror is connected to the air sample pump. You will note the outlet of the pump has been fitted with a flow meter.
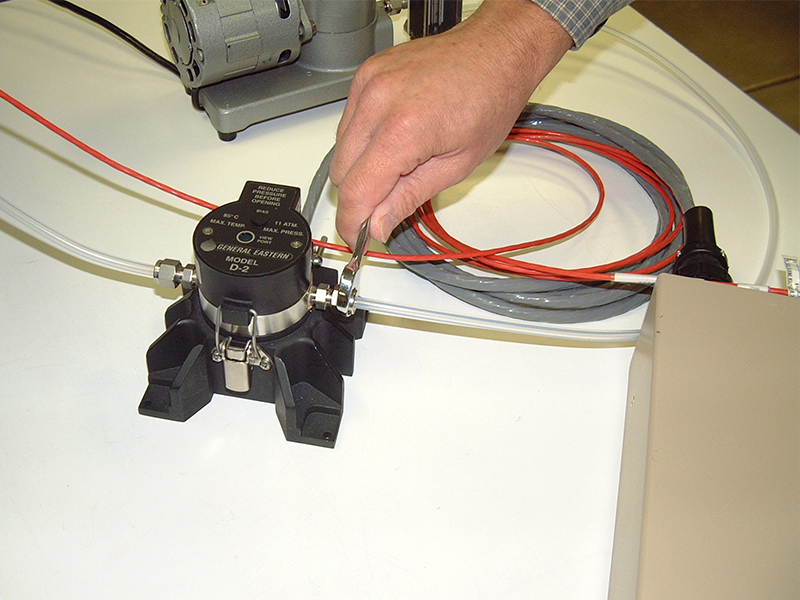
Figure 5.9
Tighten the fittings as shown.
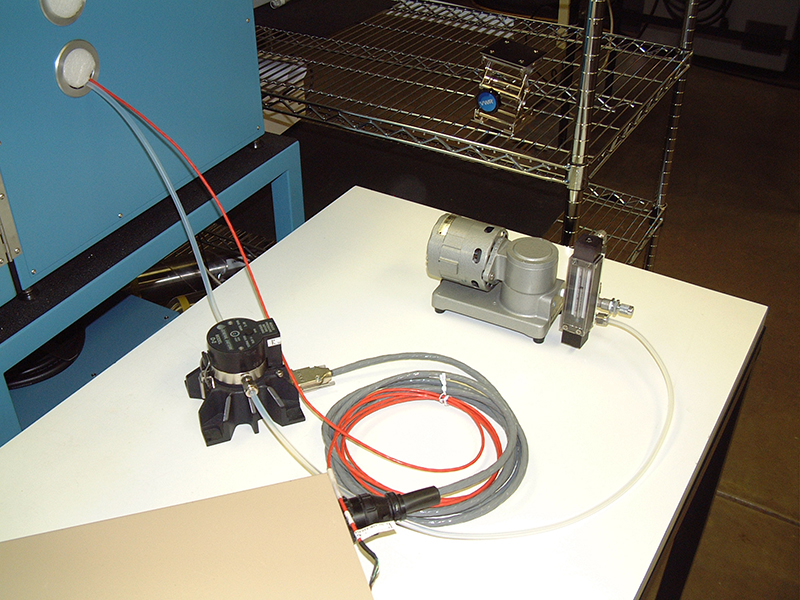
Figure 5.10
The sample tube and air pump as illustrated are ready for calibration.
Connect the dewpoint mirror and air temp probe to the connections on the display.
Apply AC power to the sample air pump and dew point hygrometer.
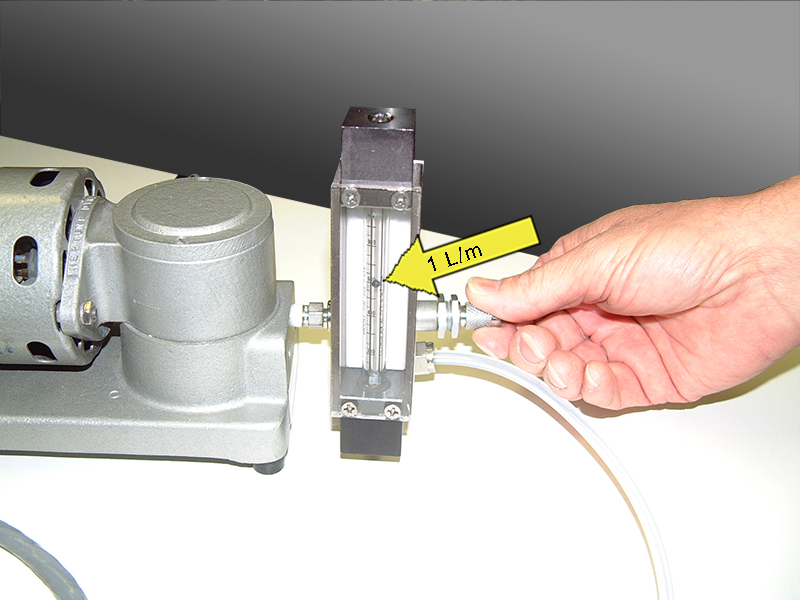
Figure 5.11
The flow meter connected to the outlet of the sample air pump is adjusted for a value less than 1 SLPM. It is important to have adequate flow rate over the dewpoint mirror. A flow rate of less than 1 SLPM is specified by the manufacturer. To much flow over the mirror will cause instability and accuracy problems.
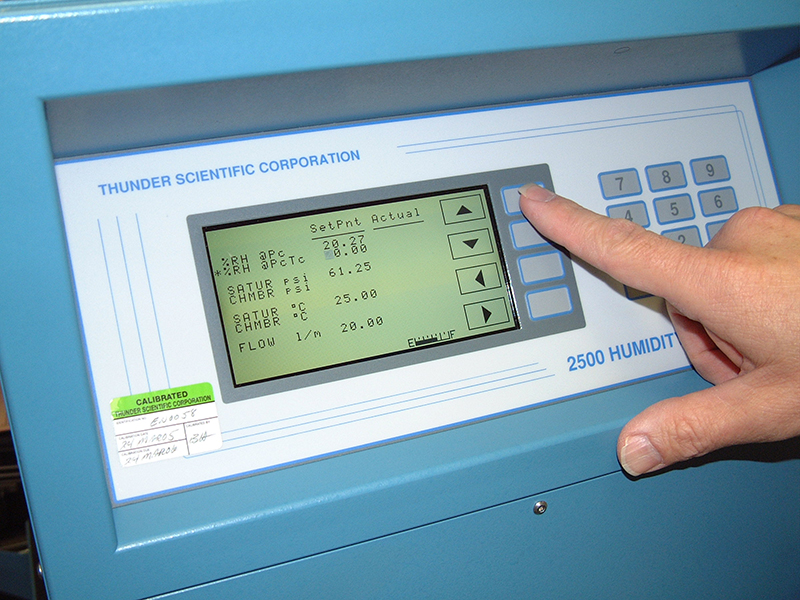
Figure 5.12
Apply AC power to the Model 2500 and air compressor accessory.
Change the setpoint on the 2500 control screen to 20% RH at PC/TC, change the chamber temperature setpoint to 25 °C.
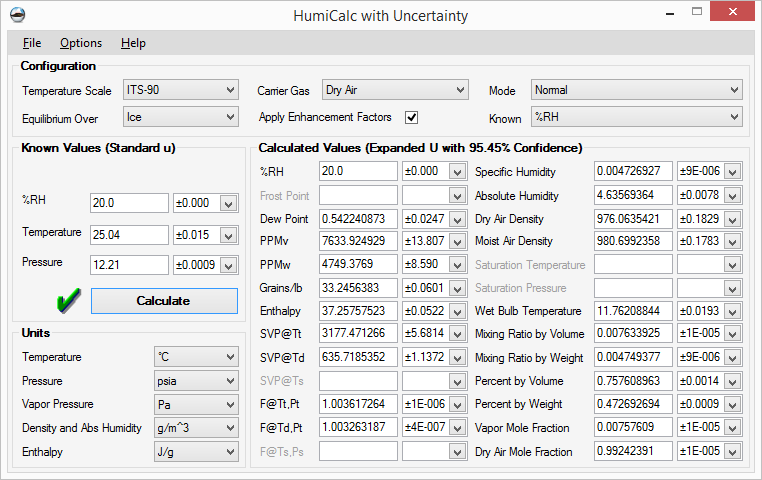
Figure 5.13
Using HumiCalc® we will calculate the dewpoint for a humidity setpoint of 20% RH.
In the Normal mode select %RH as the known value, input the chamber test temperature of 25 °C, input the test pressure as displayed on the 2500 screen Chamber PSI.
The calculated dewpoint for 20% RH as displayed in the example is 0.54224 DP.
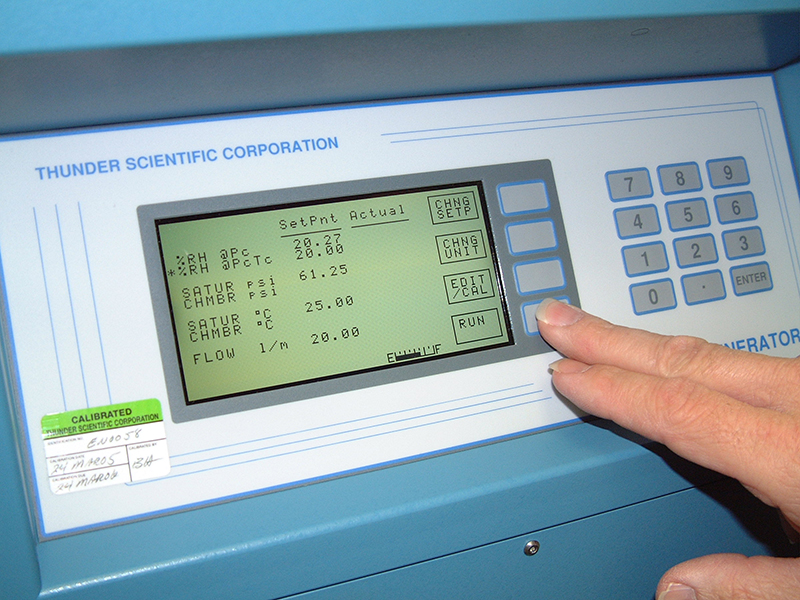
Figure 5.14
Press RUN to start the 2500 and begin the calibration. If you are using ControLog Automation software click Run and select Generate. As a rule of thumb we will allow the 2500 system and dew point hygrometer to warm up for 60 minutes before taking our first test point. The test point interval will be 30 minutes after the initial warm up.
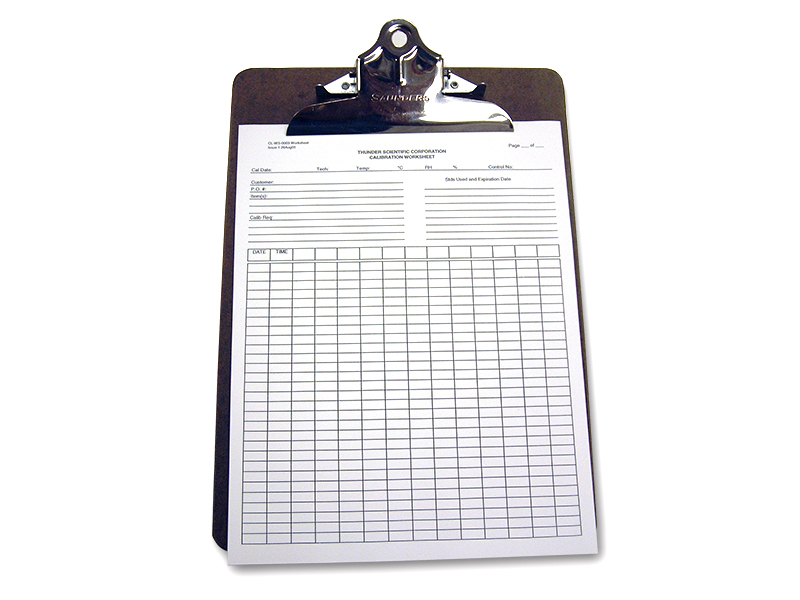
Figure 5.15
Thunder metrologists use a calibration worksheet to record data from the 2500 and the device under test. Ambient test conditions in the lab are noted and dated on the work sheet. Data collected from the 2500 will include the headings as listed in this example.
“List the headings from TSC calibration worksheet Date Time etc”.
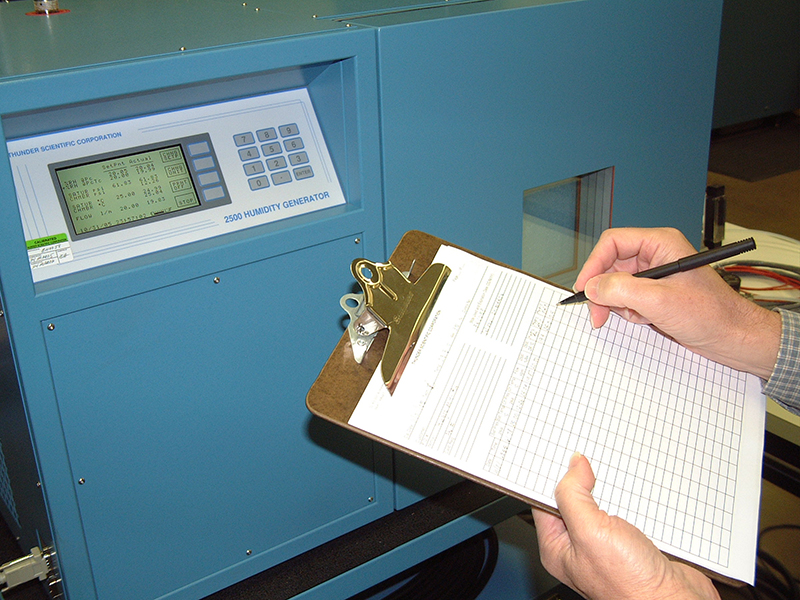
Figure 5.16
After 60 minutes we are ready to take a test point at 20% RH at 25 °C. Record the readings from the 2500 and dewpoint hygrometer.
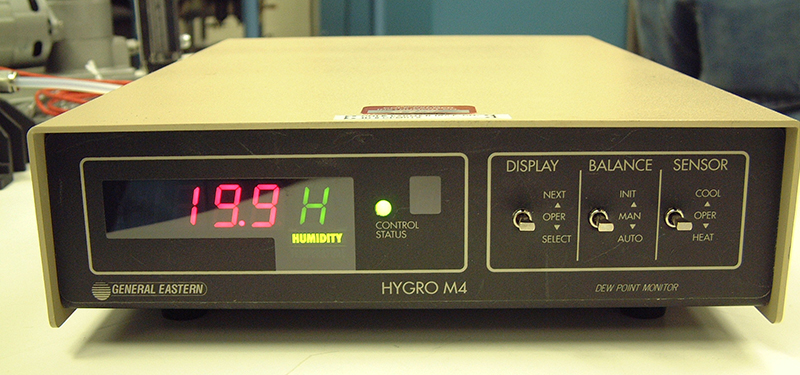
Figure 5.17
Humidity output reading @ 20% RH.
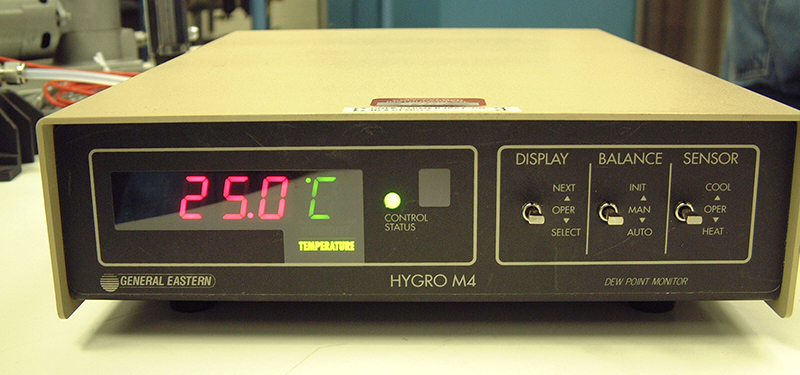
Figure 5.18
Temperature output reading in degrees C.
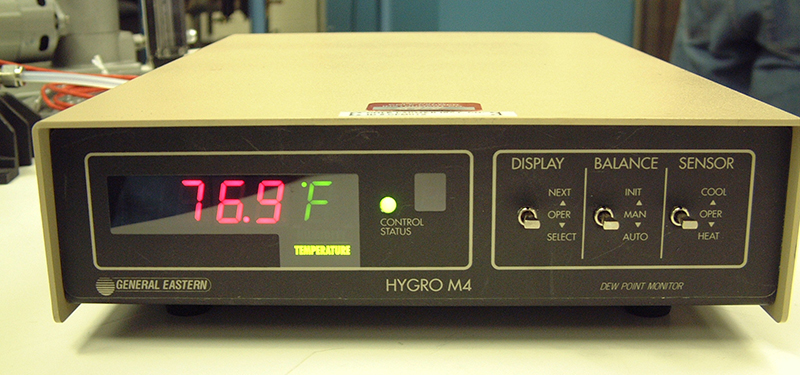
Figure 5.19
Temperature output reading in degrees F.
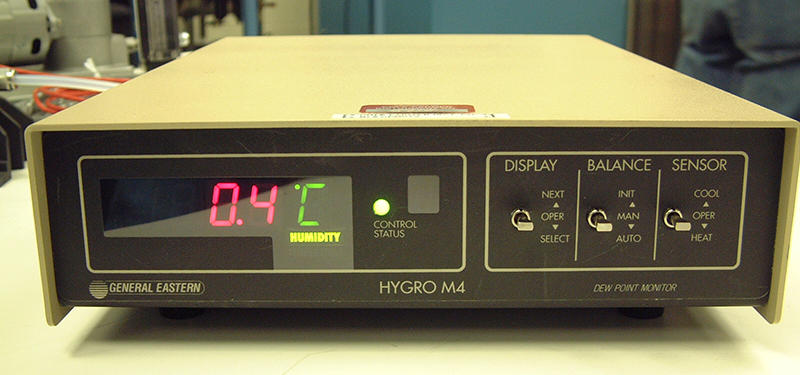
Figure 5.20
Dew Point output degrees C.
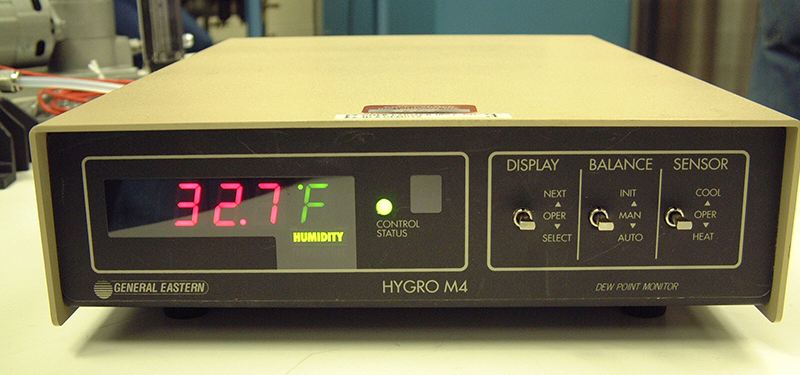
Figure 5.21
Dew point output degrees F.
The displayed output values from the hygrometer are illustrated in sequence Fig. 5.17-5.21.
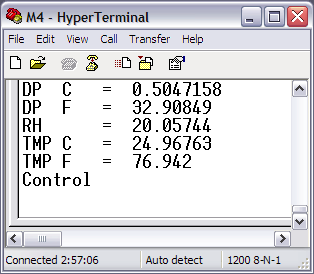
Figure 5.22
In addition to the manual readings the serial output from the hygrometer has been recorded using a terminal program on a PC laptop. The displayed values offer higher resolution and permanent record for the 20 % RH test point.
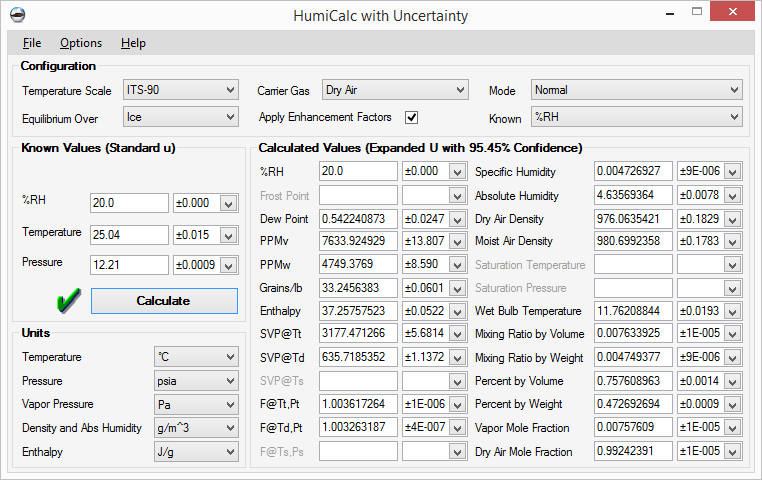
Figure 5.23
Using HumiCalc® the dew point value has been calculated at the 20% RH test point using the measured values from the 2500.
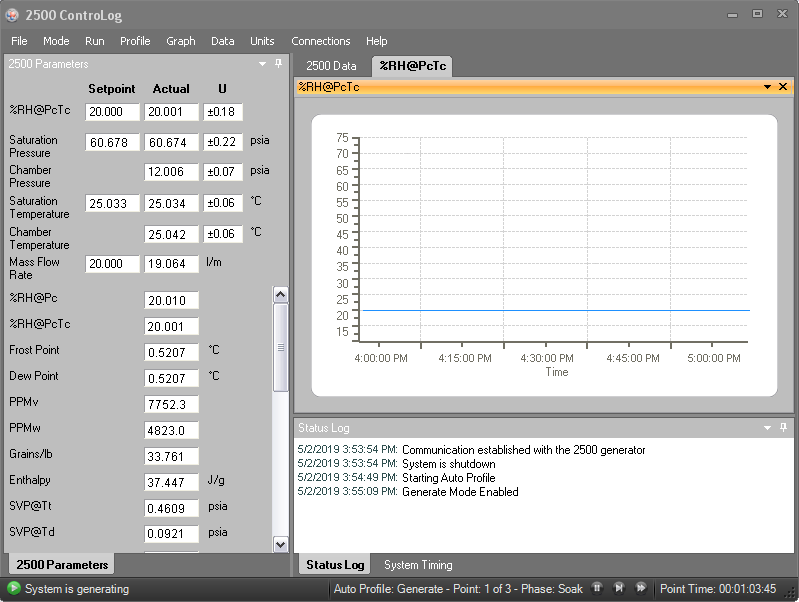
Figure 5.24
The display screen from ControLog® Automation Software is shown in Fig 5.24, note the dewpoint value is displayed in the calculated humidity parameters. Using ControLog® in conjunction with the serial output from the hygrometer will save time recording and storing calibration data.
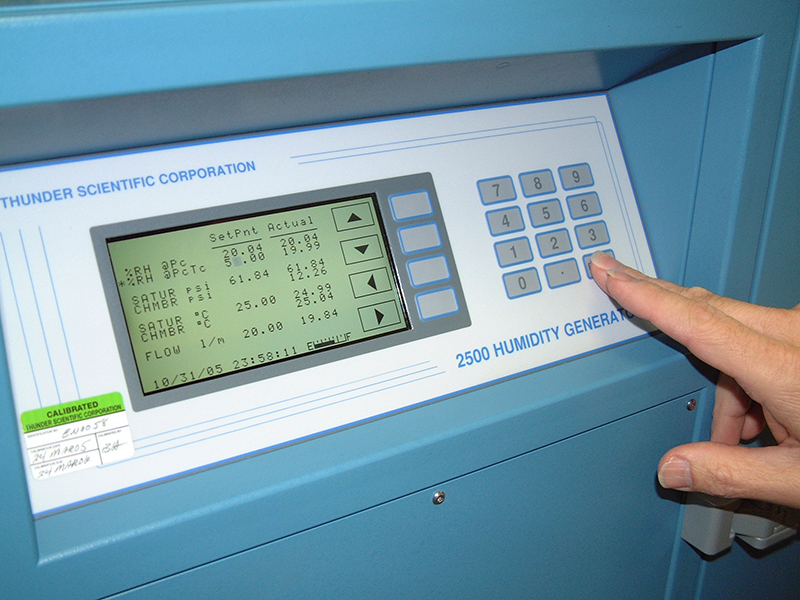
Figure 5.25
Change the setpoint on the 2500 to 50% RH at 25 °C. When using ControLog click on the humidity setpoint and input the new setpoint of 50% RH. The setpoint stabilization time will be 30 minutes. Record the readings from the 2500 and dewpoint hygrometer at 50% RH.
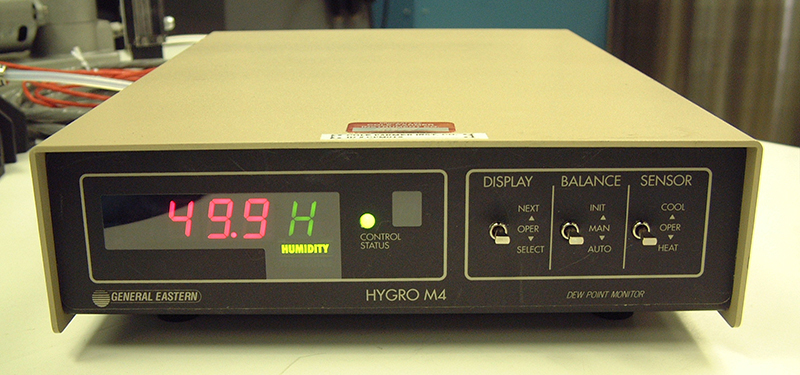
Figure 5.26
Humidity output reading @ 50%.
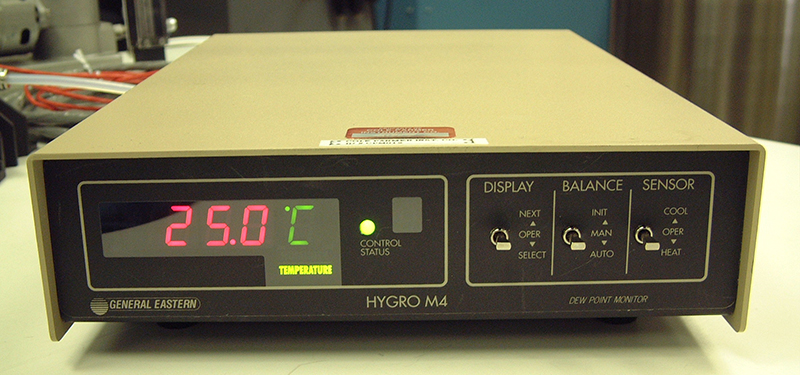
Figure 5.27
Temperature output reading in degrees C.
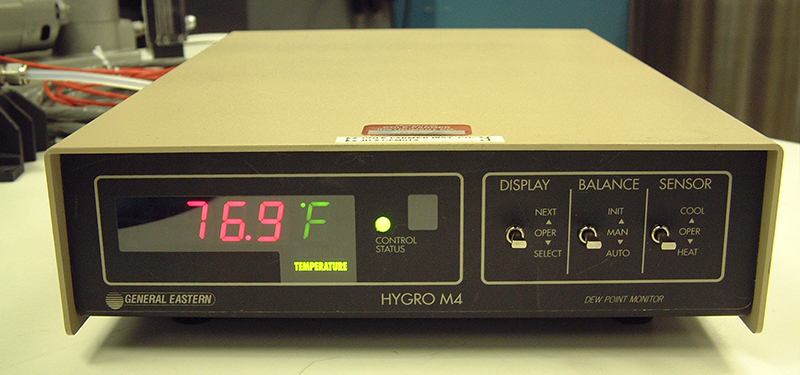
Figure 5.28
Temperature output reading in degrees F.
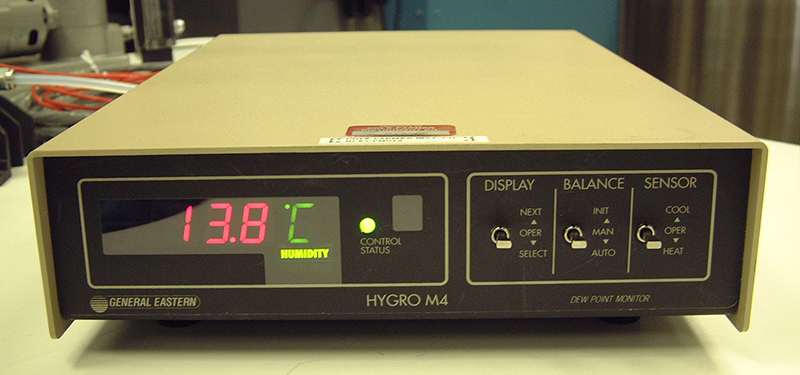
Figure 5.29
Dew Point output degrees C.
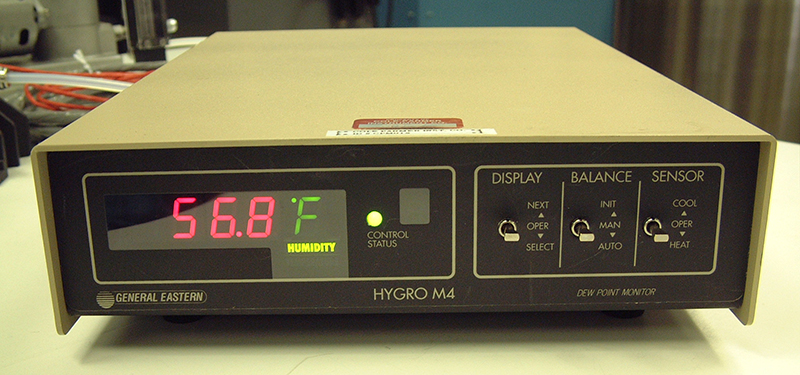
Figure 5.30
Dew Point output degrees F.
The displayed output values from the hygrometer are illustrated in sequence Fig. 5.26-5.30.
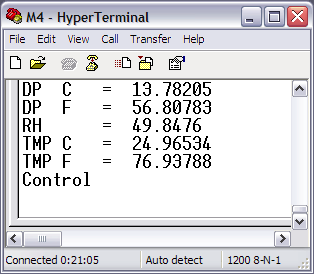
Figure 5.31
In addition to the manual readings the serial output from the hygrometer has been recorded using a terminal program on a PC laptop. The displayed values offer higher resolution and permanent record for the 50% RH test point.
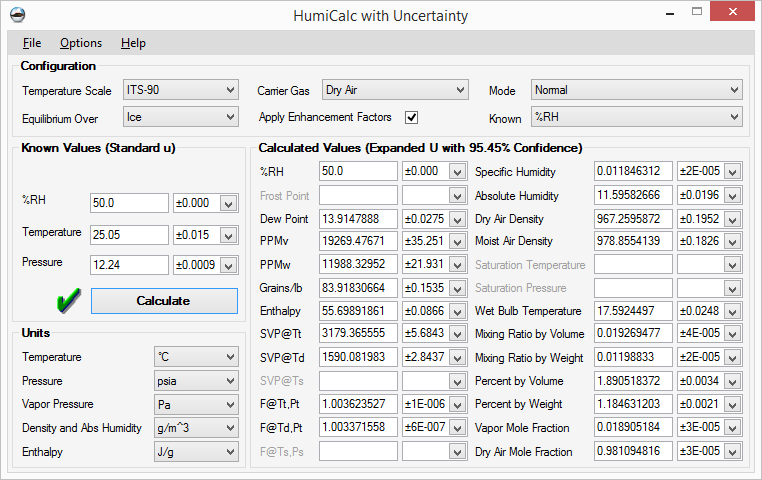
Figure 5.32
Using HumiCalc® the dew point value has been calculated at the 50% RH test point using the measured values from the 2500.
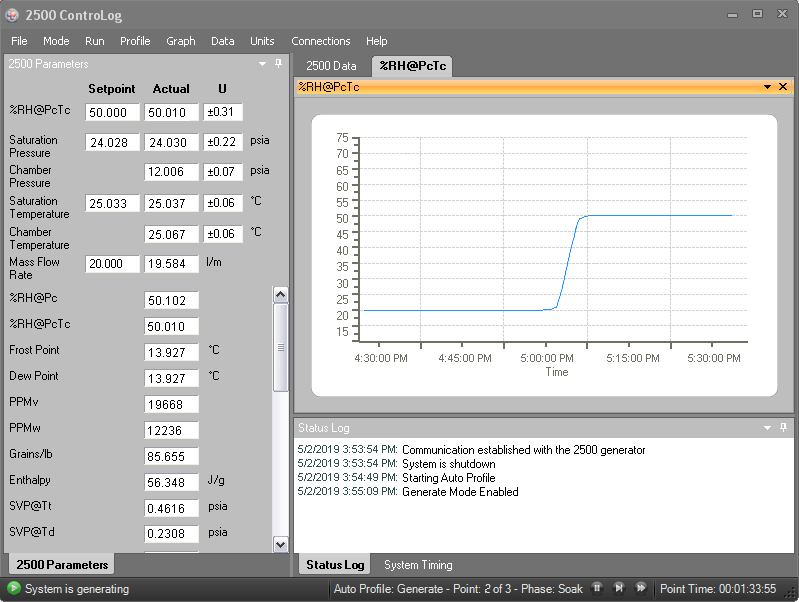
Figure 5.33
The display screen from ControLog® Automation software is shown in Fig 5.33 note the dewpoint value is displayed in the calculated humidity parameters.
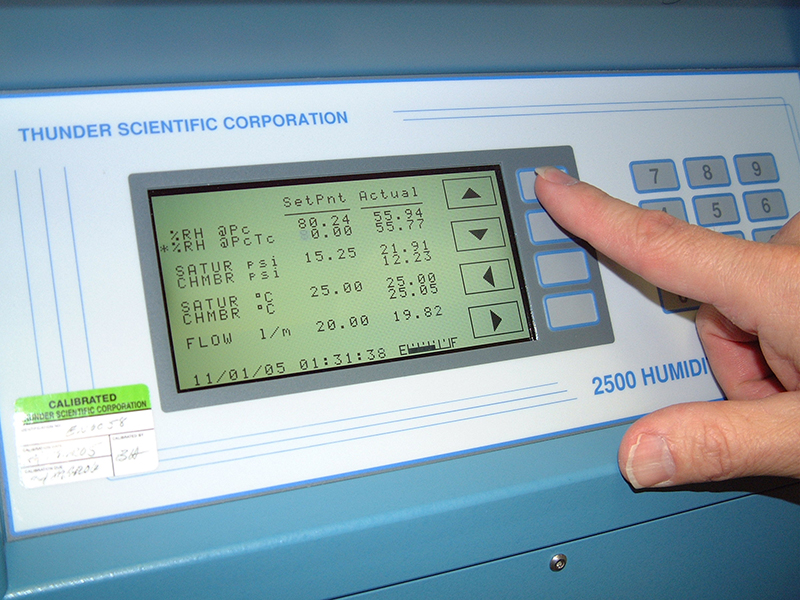
Figure 5.34
Change the setpoint on the 2500 to 80% RH at 25 °C. When using ControLog click on the humidity setpoint and input the new setpoint of 80% RH. The setpoint stabilization time will be 30 minutes.
Record the readings from the 2500 and dewpoint hygrometer at 80% RH.
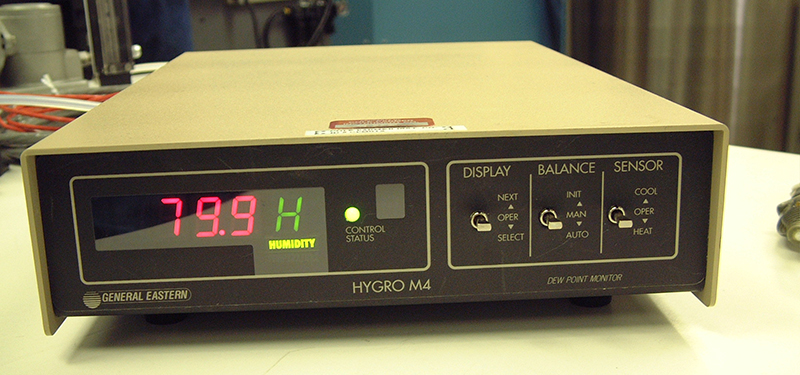
Figure 5.35
Humidity output reading @ 80% RH.
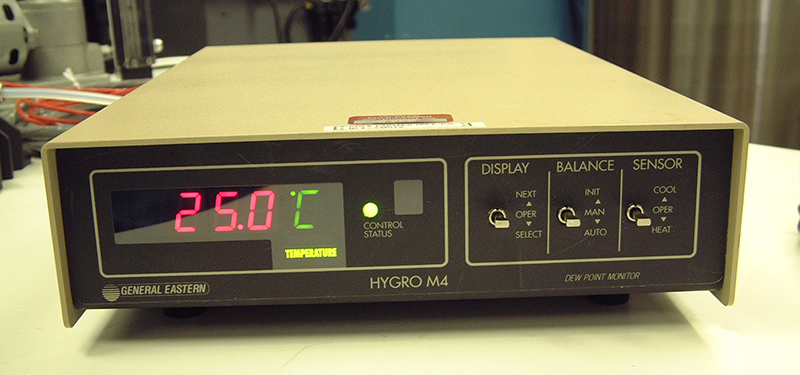
Figure 5.36
Temperature output reading in degrees C.
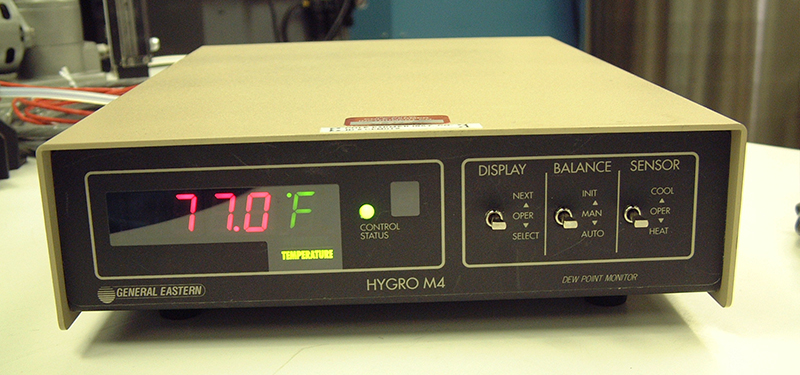
Figure 5.37
Temperature output reading in degrees F.
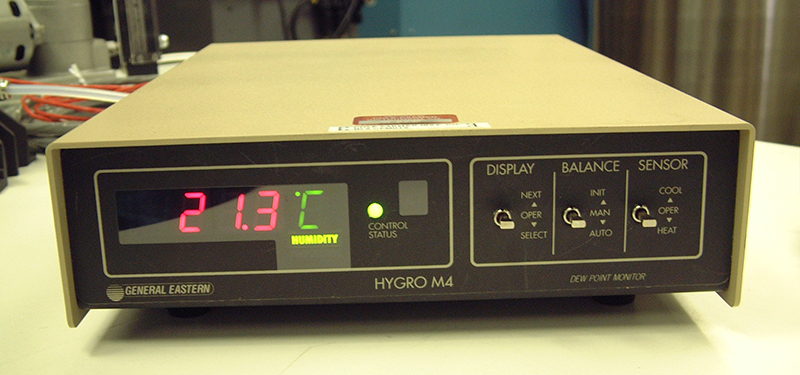
Figure 5.38
Dew point output degrees C.
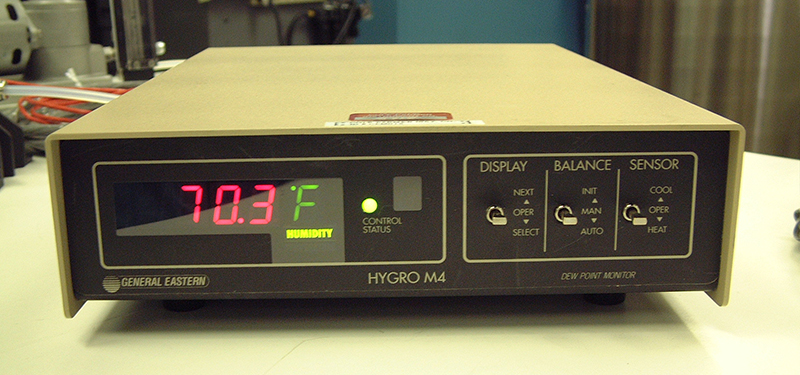
Figure 5.39
Dew point output degrees F.
The displayed output values from the hygrometer are illustrated in sequence Fig. 5.35-5.39.
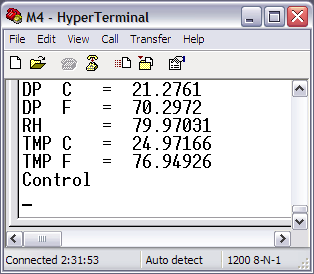
Figure 5.40
In addition to the manual readings the serial output from the hygrometer has been recorded using a terminal program on a PC laptop. The displayed values offer higher resolution and permanent record for the 80 % RH test point.
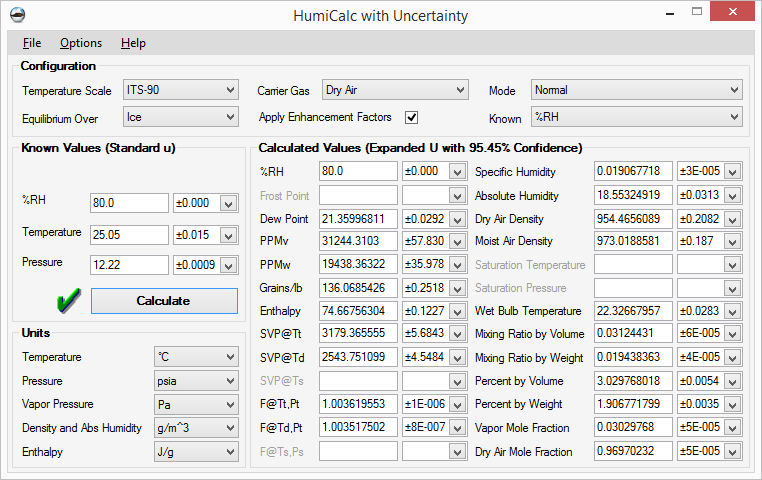
Figure 5.41
Using HumiCalc® the dew point value has been calculated at the 80% RH test point using the measured values from the 2500.
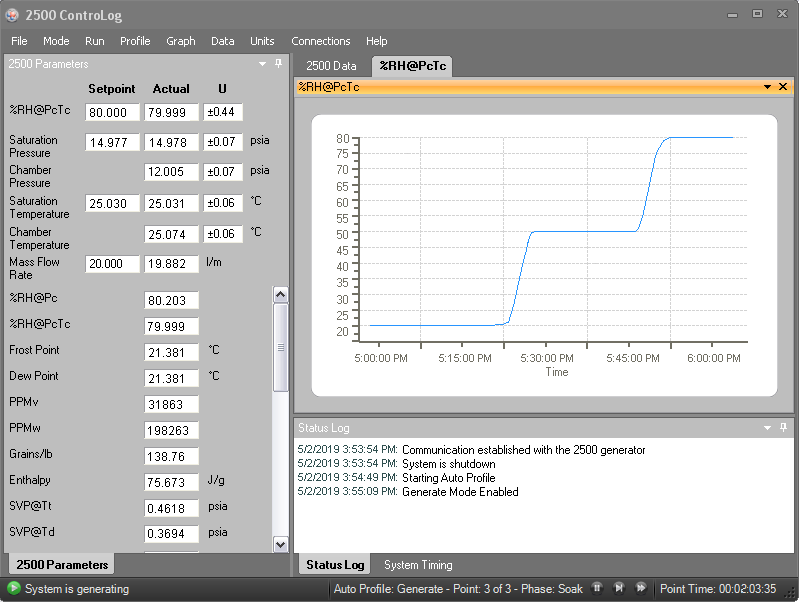
Figure 5.42
The display screen from ControLog® Automation software is shown in Fig 5.42 note the dewpoint value is displayed in the calculated humidity parameters.
The initial as found calibration is complete. The dew point mirror should be cleaned and inspected as per the manufacturers recommendation before testing the as left calibration of the dew point hygrometer.
The as left calibration will be performed using the same test points beginning at 20% RH, test point interval will be 30 minutes.
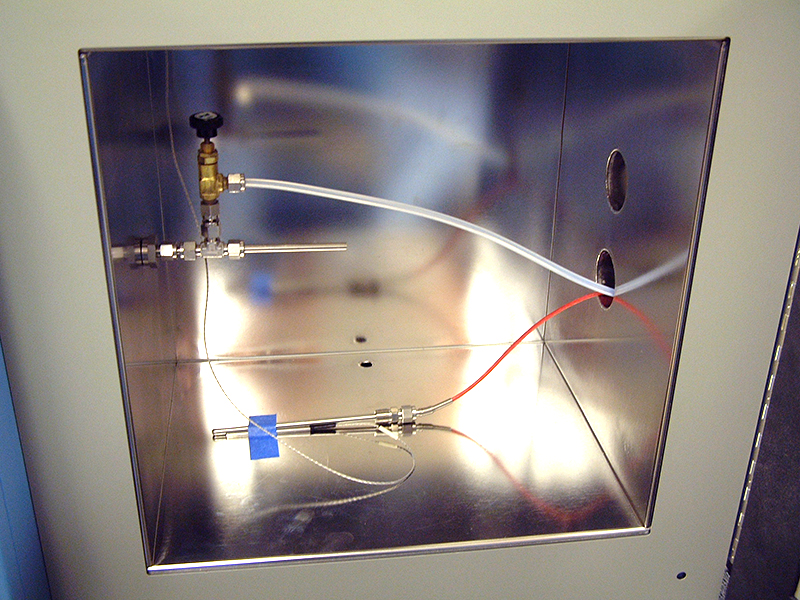
Figure 5.43
An alternate test setup when the air sample pump is not available is shown in the following illustrations.
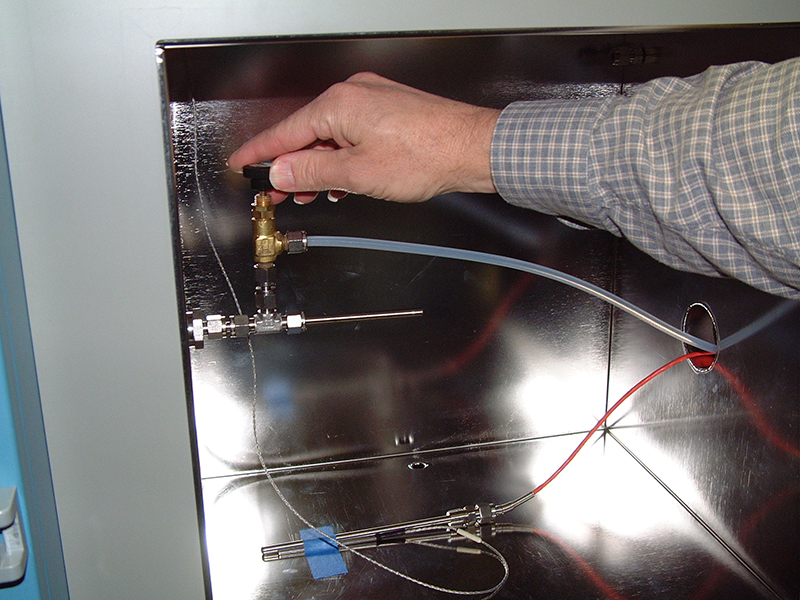
Figure 5.44
A tee fitting with needle adjustment valve has been assembled and threaded into the 2500 chamber inlet port. The inlet of the tee fitting is open to the test chamber. The sample tube is connected to the needle valve at one end, the other end is connected to the dew point mirror. The 2500 chamber temp sensor and hygrometer temp probe have been taped to the bottom of the test chamber.
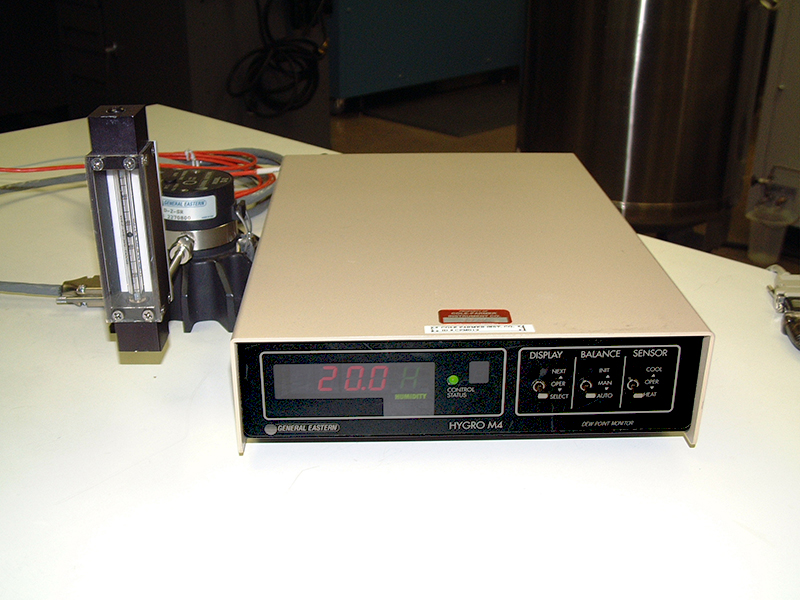
Figure 5.45
The outlet from the mirror is shown connected to the flow meter. It will be necessary to run the 2500 at the first test point and adjust the needle valve for proper flow rate through the dew point mirror as shown in Fig 5.44 Wait 5 minutes for the 2500 to stabilize at the setpoint before attempting the flow rate adjustment.
Please contact support@thunderscientific.com should you have questions or problems using the procedure. We always appreciate your comments and feedback.
Thunder Calibration Support
High Dew Point Calibration
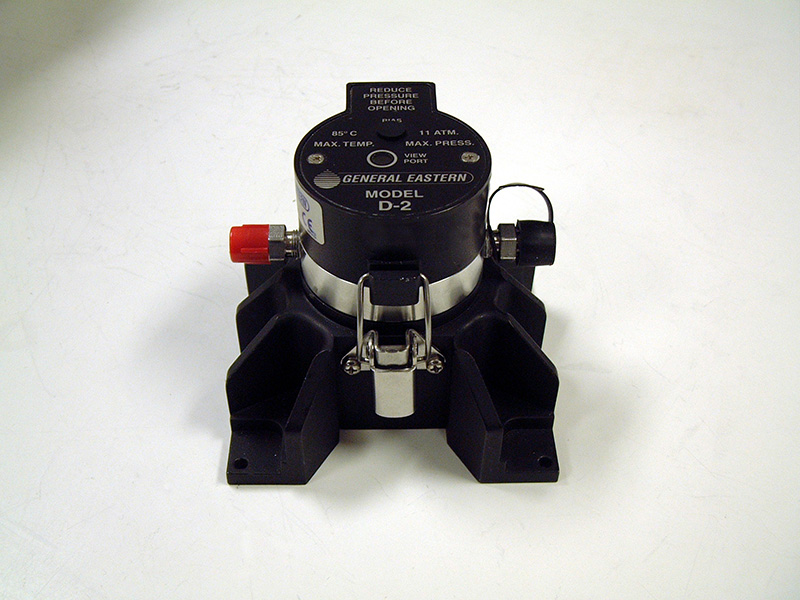
Figure 6.1
Calibration at dew points above ambient temperatures...
A typical dew point sensor shown here is the General Eastern Model D-2.
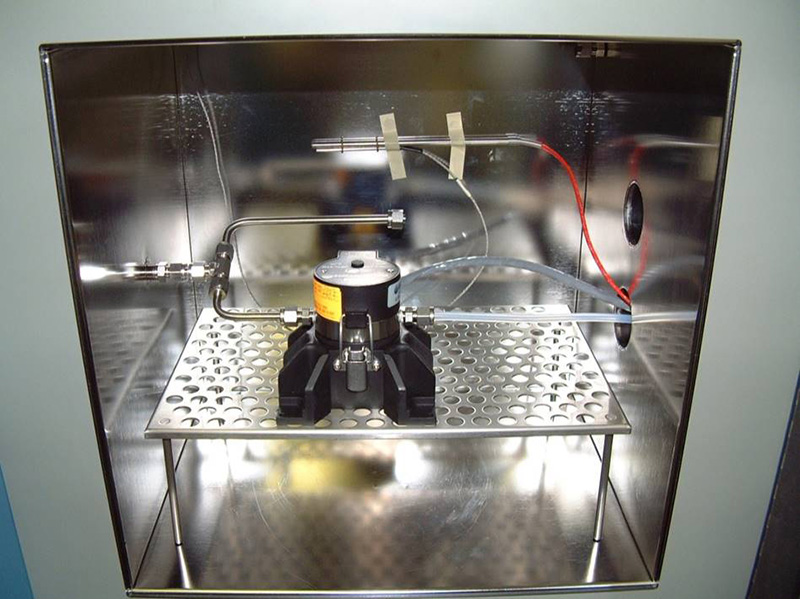
Figure 6.2
Install the dew-point sensor in the test chamber as shown in Fig 6.2 in this example a shelf is used to position the dew-point sensor in-line with the access port.
The temperature probe from the test instrument DUT will be taped to the back wall of the test chamber with the 2500 chamber temperature sensor.
A tee fitting is installed at the chamber inlet for connection to the dew-point sensor; note an open tube on the opposite end of the tee fitting is used to direct the additional flow into the test chamber. The outlet of the dew-point sensor is connected to clean ¼” Teflon tubing, the sample line should be sloped downward from the dew-point sensor to prevent condensation in the tubing from draining back to the dew-point sensor.
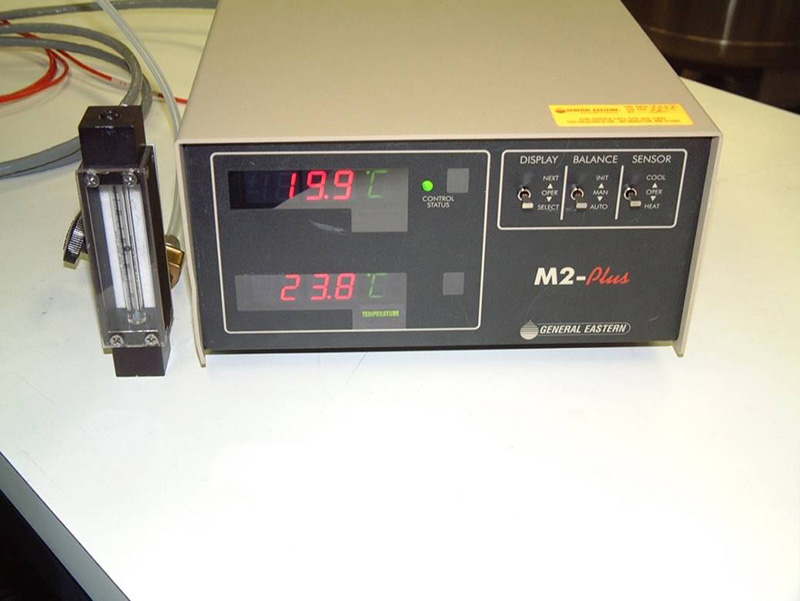
Figure 6.3
The outlet tubing is connected to an adjustable valve and flow meter. Change the 2500 flow rate to 10 SLPM, adjust the valve to a flow rate of 1 SLPM at the flow meter.
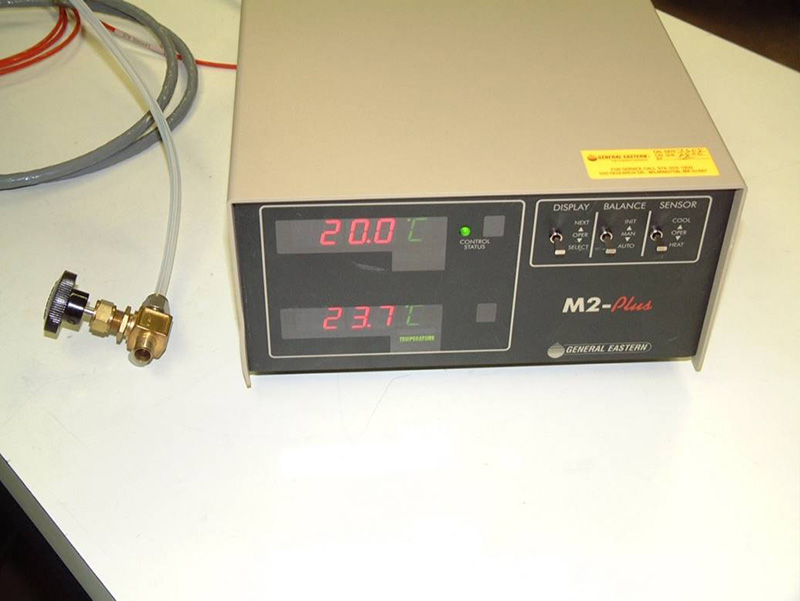
Figure 6.4
Note the flow meter will be removed during the calibration due to the potential condensation at the outlet tube.
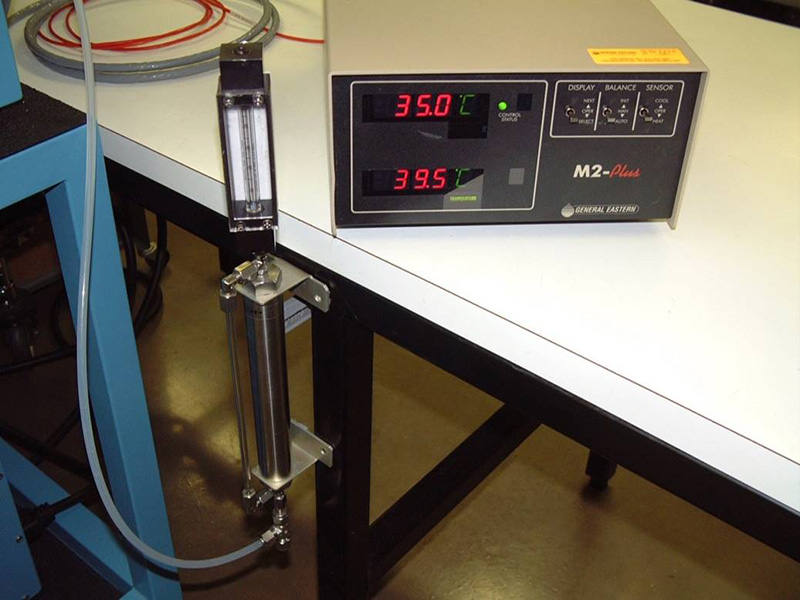
Figure 6.5
A condensate trap can be used to collect condensing moisture before the flow meter as shown in Fig 6.5.
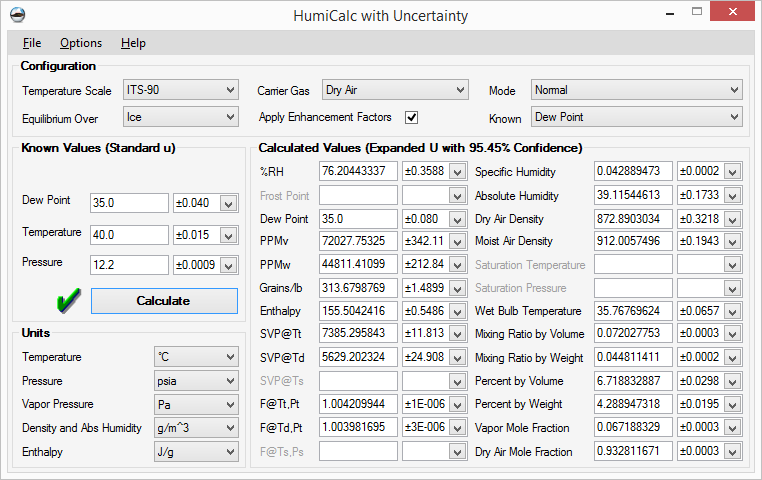
Figure 6.6
The target test point for this calibration is +35 °C dew-point, to accomplish this elevated dew-point it will be necessary to operate the test chamber at a test temperature of 40 °C.
Using HumiCalc® we can calculate the humidity set point at 40 °C test temperature to achieve the desired dew-point. Please view HumiCalc® example screen Fig 6.6.
Select Normal Mode, the known value will be Dew-Point DP, the test temperature needs to be higher than the known dew-point DP, enter 40 °C test temp, enter 35 °C for the known dew-point DP value. The %RH calculated is 76.20 %RH.
Begin the Calibration Test
You should begin the calibration test at a lower %RH set point until the test chamber temperature is within 2 degrees of the desired set point of 40 °C, as an example start the test at 20 %RH until the test chamber actual displays 38 °C, change the humidity set point to 76.20 %RH and allow the 2500 to stabilize for a minimum of 30 minutes. Wait for the DUT dew-point indication to stabilize before recording the calibration point.
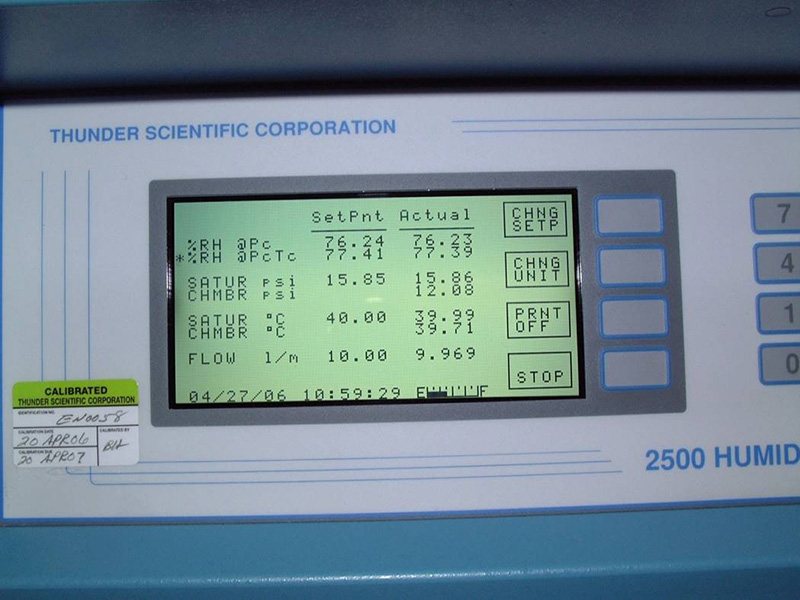
Figure 6.7
Input actual humidity, chamber temperature and chamber pressure, press calculate, HumiCalc® will display the generated dew-point as shown in Fig. 6.7. A normal test time duration of 2 hours will be required to complete this test.
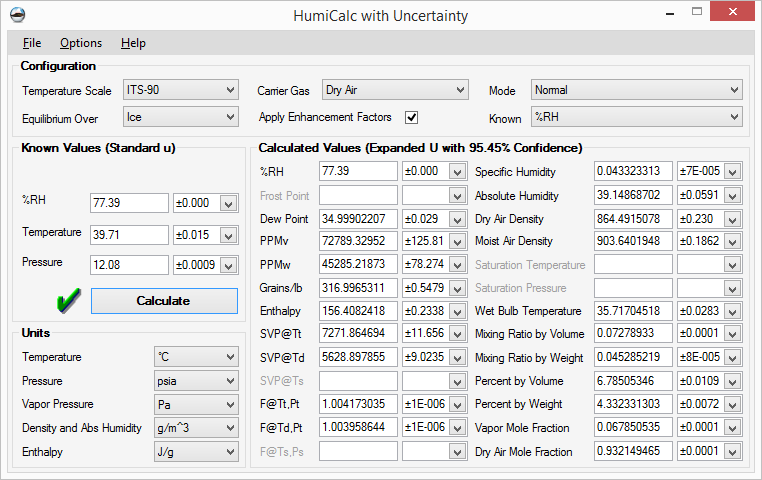
Figure 6.8
Using HumiCalc® calculate the actual generated dew-point using the values displayed on the 2500 screen Figure 6.8.
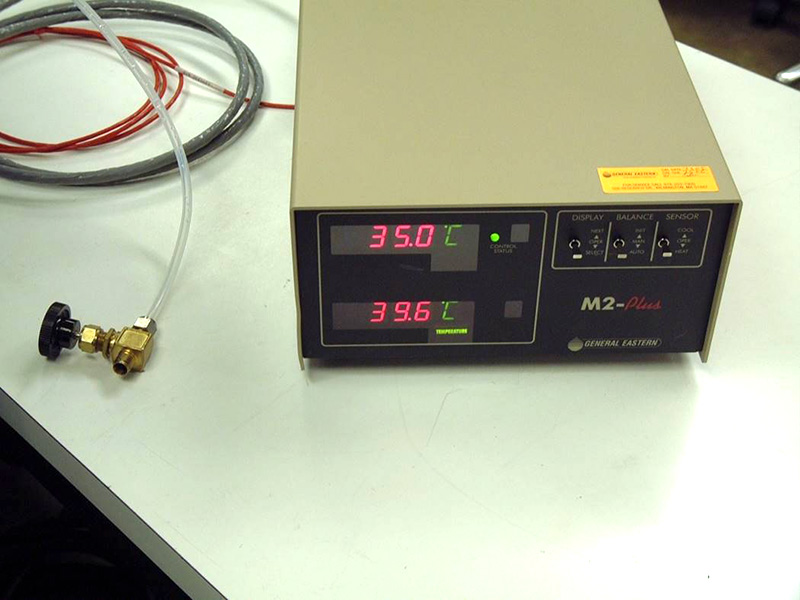
Figure 6.9
DUT display at a humidity set point of 77.39 calculated dew point 34.999, test temperature of 39.71.
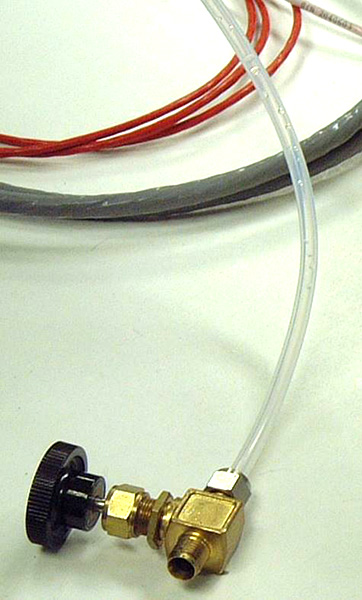
Figure 6.9.1
Note the Condensation in the Tube. See Figure 6.9.1
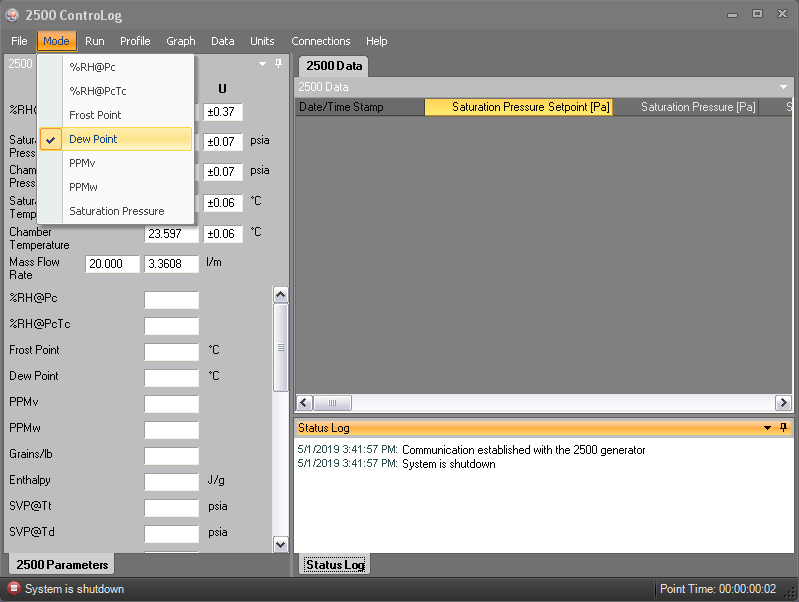
Figure 6.10
Using ControLog® Automation software under Mode menu tool bar select Dew Point.
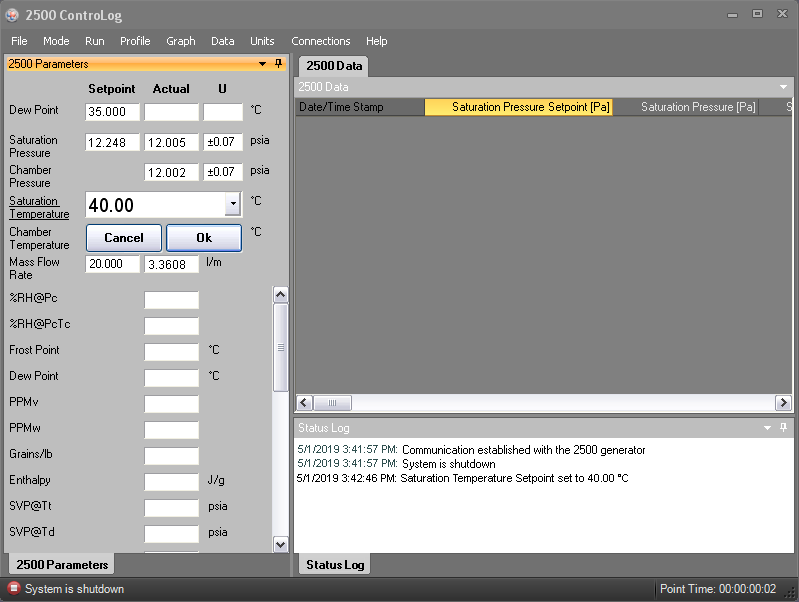
Figure 6.11
In ControLog®, click on the the Saturation Temp Field on the 2500 Control Parameters tab, the Saturation Temp dialog box will appear, change the test temperature to 40 °C. Then click the OK button.
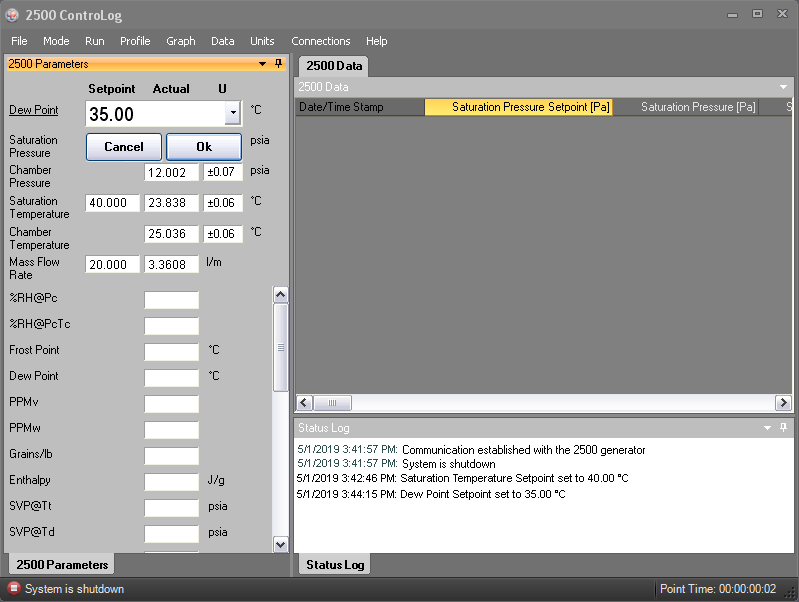
Figure 6.12
Next click on the the Dew Point Field on the 2500 Control Parameters tab, and enter 35.0 °C and Click OK.
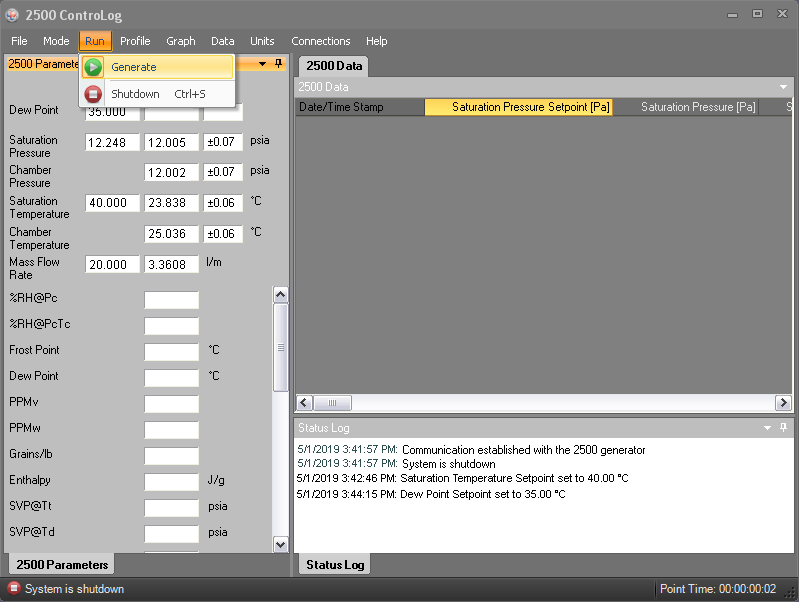
Figure 6.13
On the Run menu select Generate and begin the calibration test.
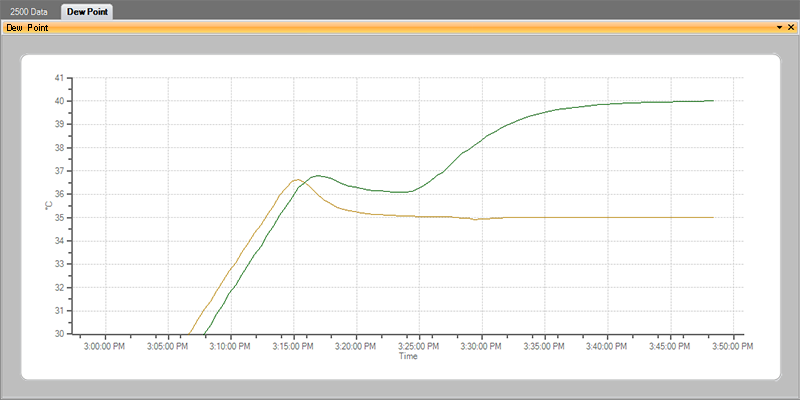
Figure 6.14
After the generation cycle, figure 6.14 shows what a normal run should look like.
You should begin the calibration test at a lower dew point until the test chamber temperature is within 2 degrees of the desired set point of 40 °C, as an example start the test at 20 °C dew point until the test chamber actual displays 38 °C, change the dew point set point to 35 °C dew point and allow an additional 30 minutes for stabilization.
A normal test time duration of 2 hours will be required to complete this test.
Please contact support@thunderscientific.com should you have questions or problems using the procedure. We always appreciate your comments and feedback.
Thunder Calibration Support
Calibration Divided Flow Humidity Generator
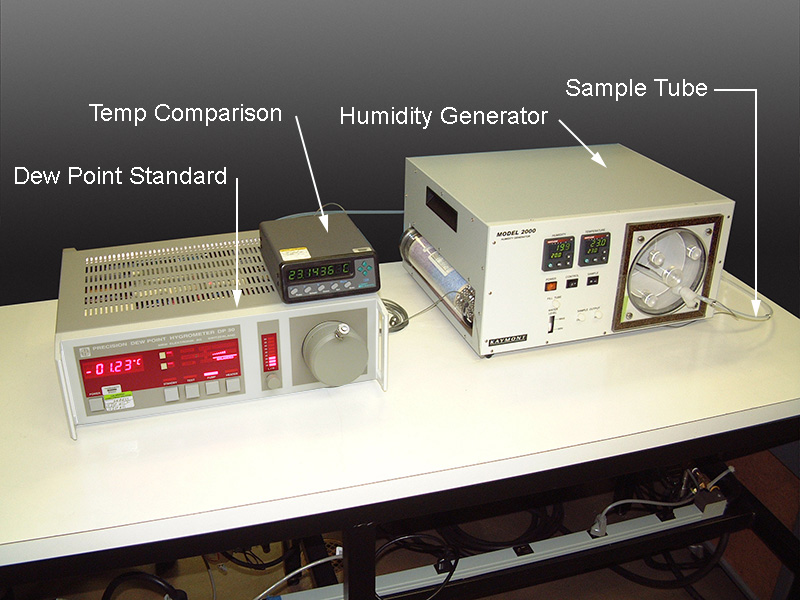
Figure 7.1
As found calibration using a precision dew point standard with an accuracy of ±0.1 °C DP.
Dew point hygrometer sample tube installed in the humidity generator test chamber.
Additional temperature measurement for as found temperature comparison.
Record as found calibration at humidity test points from 10 %RH to +90 %RH.
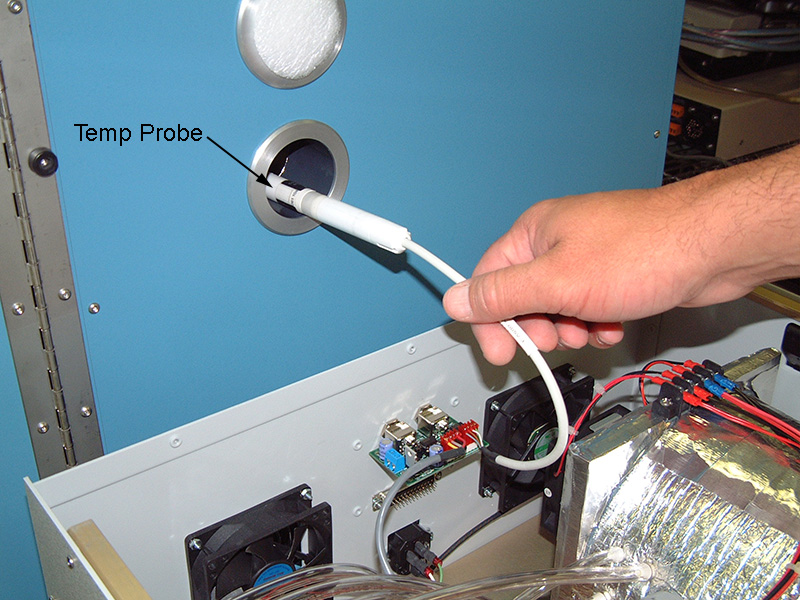
Figure 7.2
Calibrate the embedded RH/Temp probe in the Model 2500 humidity generator. Calibrate as per the manufacturers test points and procedure.
Retest the Divided Flow Humidity Generator as left calibration after calibration adjustment of the embedded RH/Temp control sensor.
Please contact support@thunderscientific.com should you have questions or problems using the procedure. We always appreciate your comments and feedback.
Thunder Calibration Support
Two-Pressure Humidity Generator Calibration
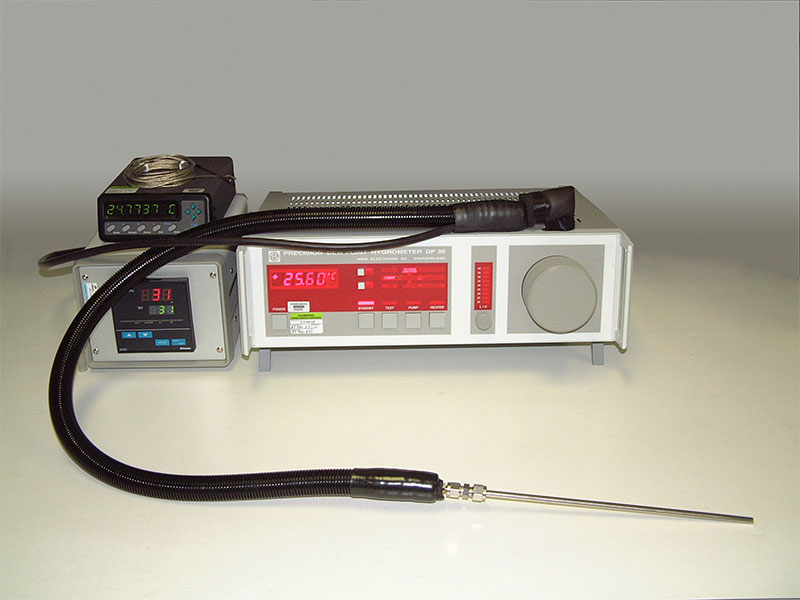
Dew point standard with an accuracy of ±0.1 °C, heated hose accessory with controller. Dew point instrument is designed with an internal sample pump to provide air flow over the dew point sensor.
Also shown is a temperature probe with an accuracy of ±0.03 °C.
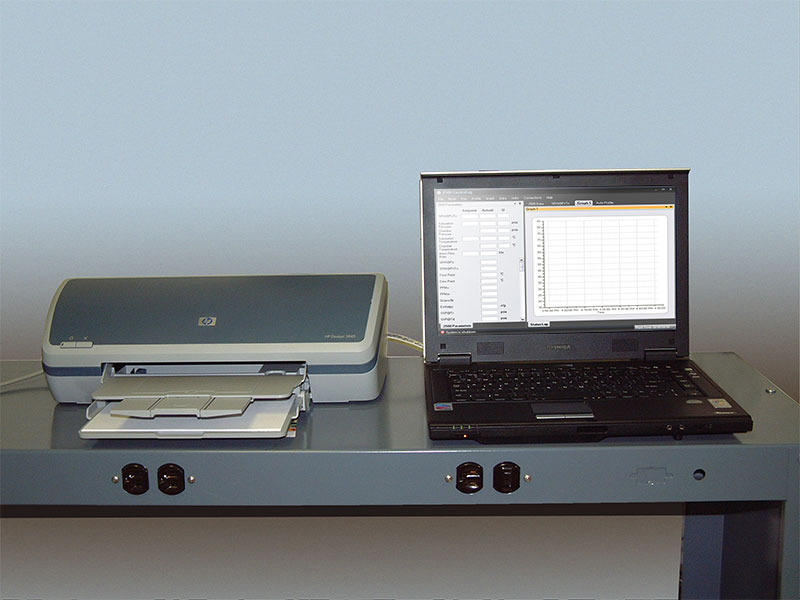
Laptop computer running ControLog® Automation software.
HumiCalc® Humidity Conversion software will be used to calculate dew point values measured from the dew point standard.
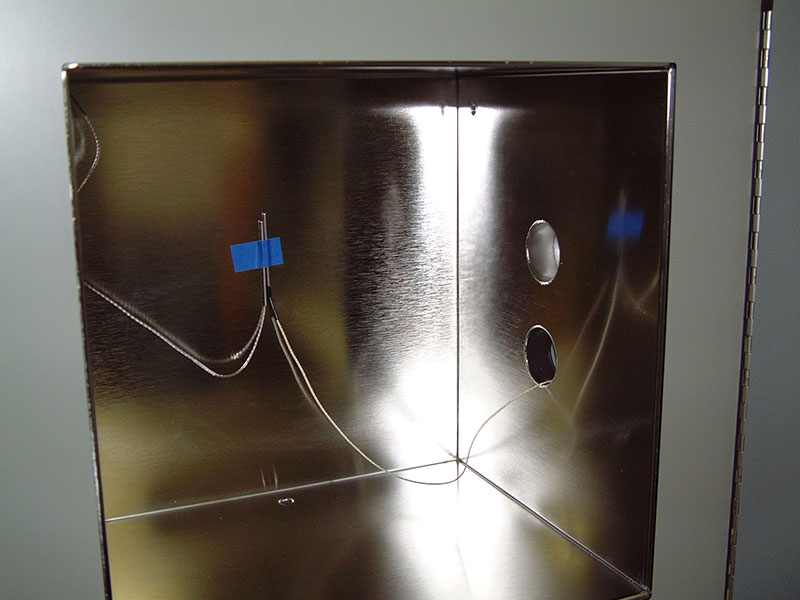
Tape the 2500 chamber temperature sensor (RTD3) together with the external temperature probe to the back wall of the test chamber or insert the probes into the calibration manifold.
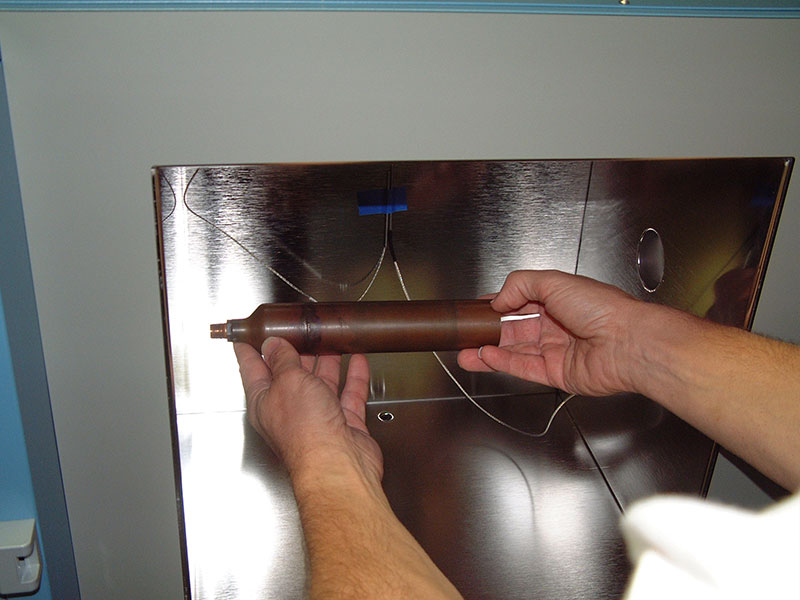
Install the calibration manifold, insert the dew point sample tube thru the access port into the manifold fixture.
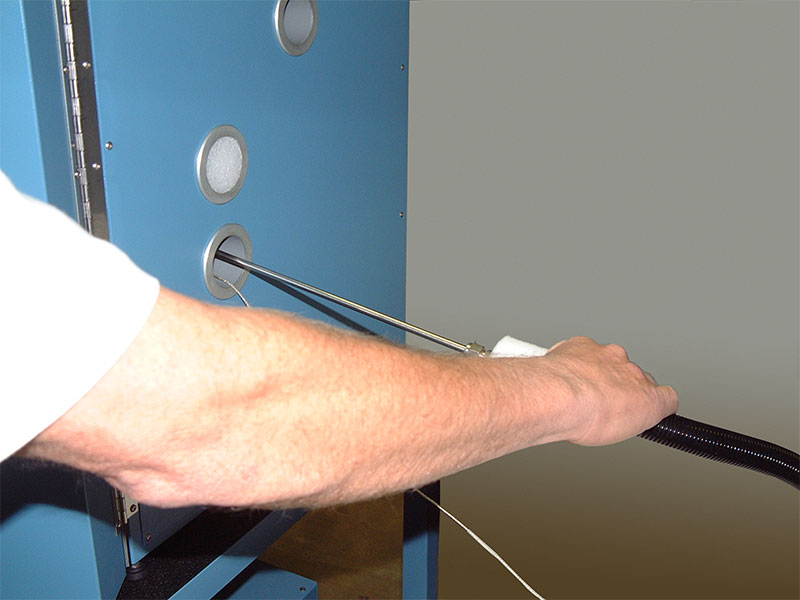
Insert the dew point sample tube thru the access port.
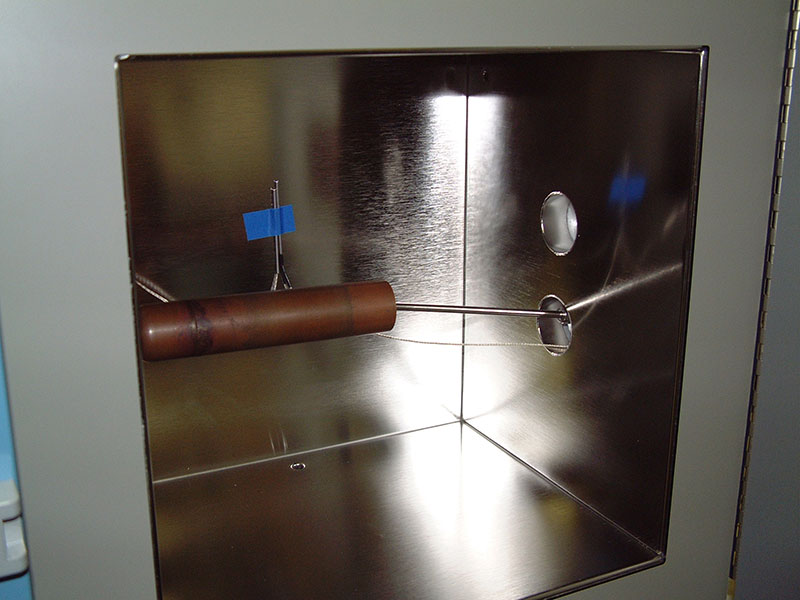
Position the dew point sample tube into the manifold fixture.
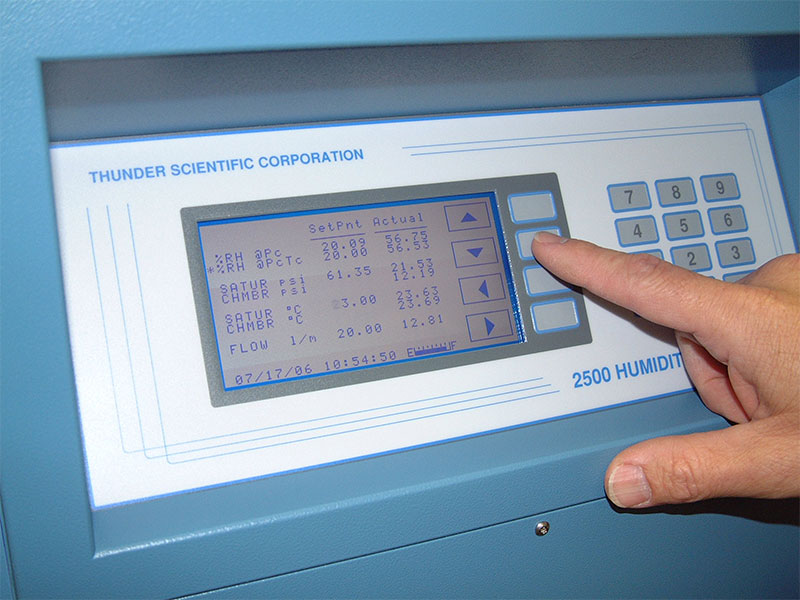
Press the CHNG SETP key. Change the %RH value to 20.0 %RH, change the satur test temp to 23.0 °C on the 2500 control screen, press the ENTER key. Allow the system to stabilize for 60 minutes.
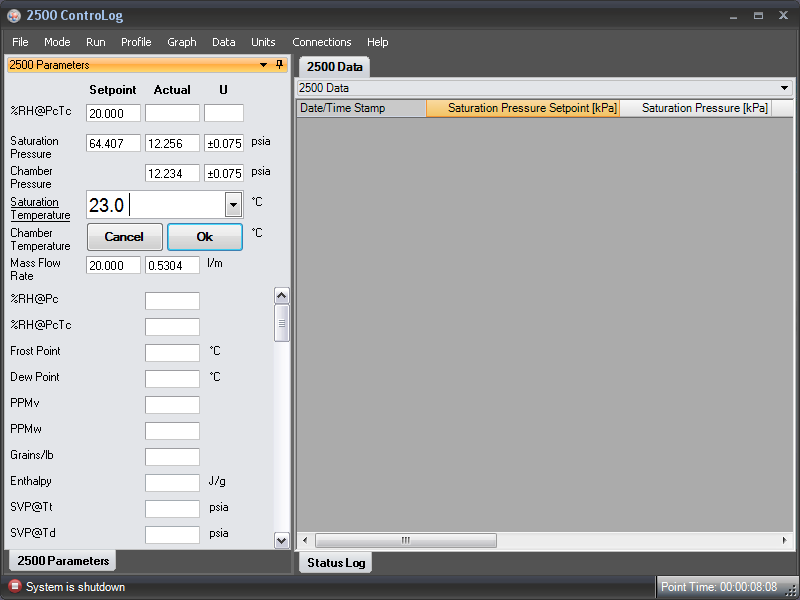
Select saturation temperature, on the 2500 Parameters tab and change the set point to 23.0 °C test temperature, select %RH set point, change the value to 20.0 %RH.
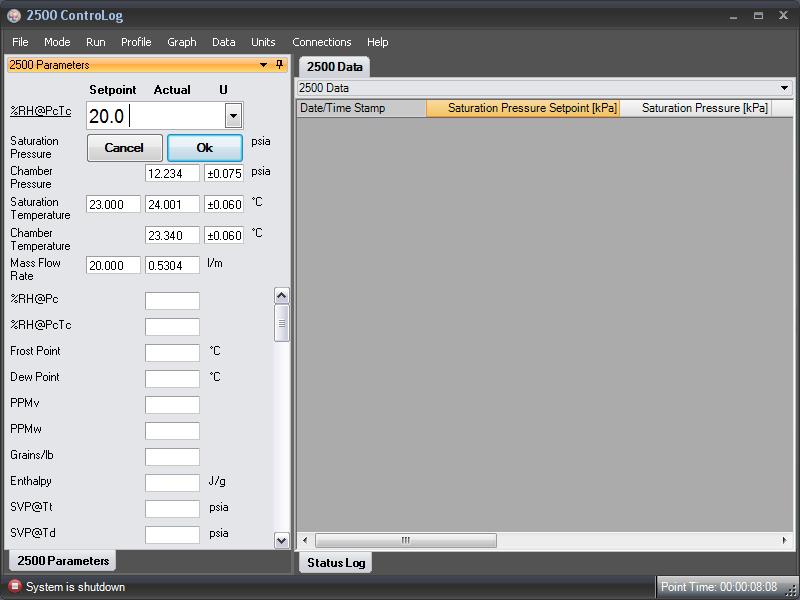
Test temperature, select %RH set point. Change the value to 20.0 %RH.
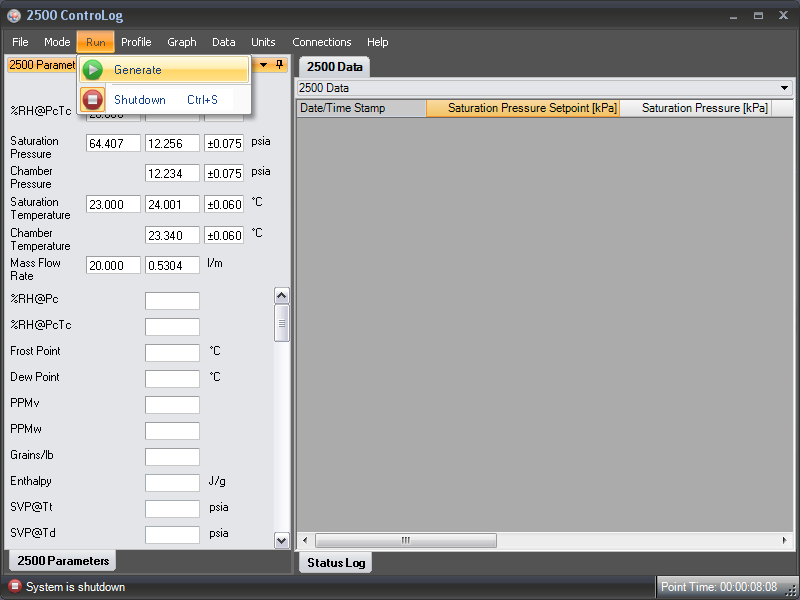
Select RUN on the menu and click on Generate to begin the calibration comparison at 23.0 °C at 20.0 %RH, allow the 2500 to stabilize for 60 minutes before taking the first test point.
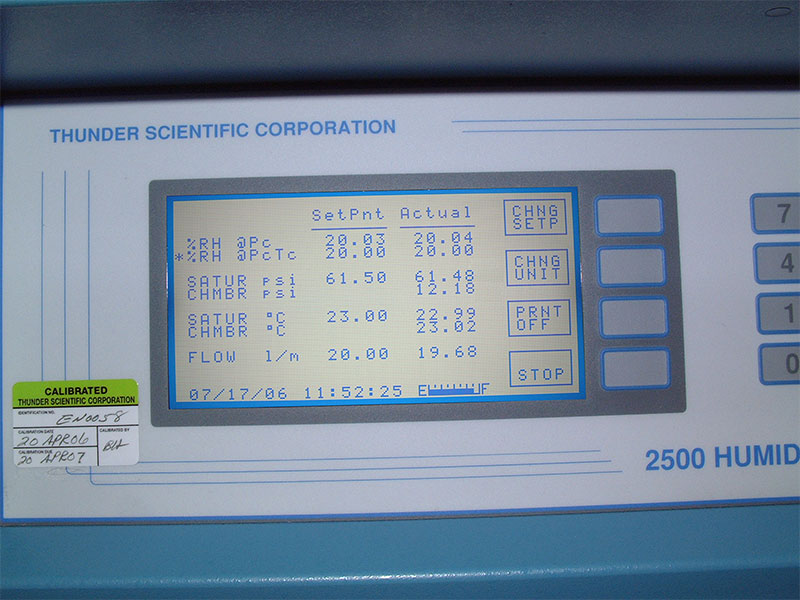
2500 display screen stable at 20.0 %RH at a test temperature of 23.0 °C.
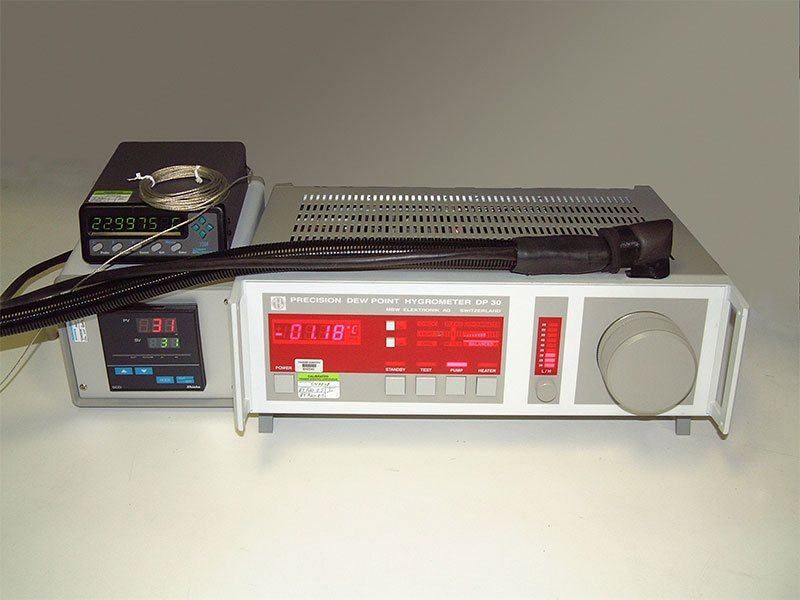
Dew point standard displays a stable dew point measurement at 20.0 %RH.
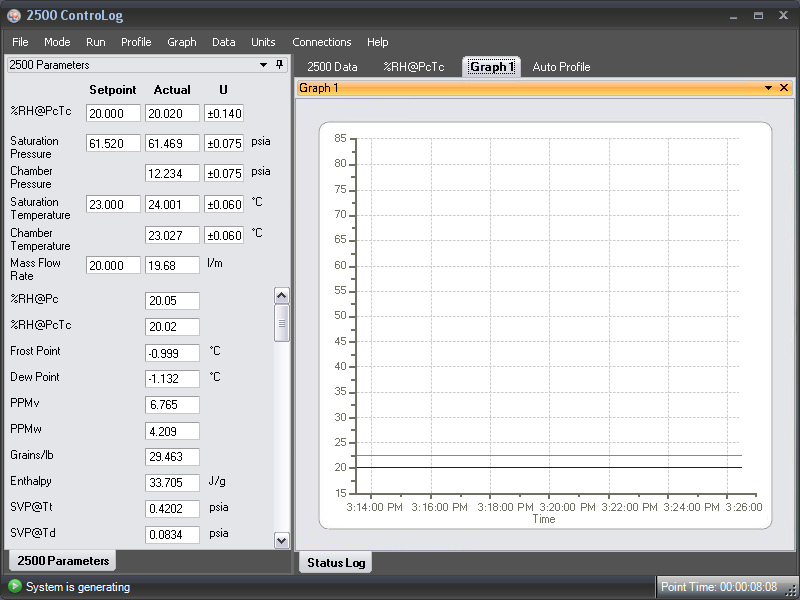
ControLog® graph displays a stable test temperature of 23.0 °C at 20.0 %RH, note the calculated dew point value.
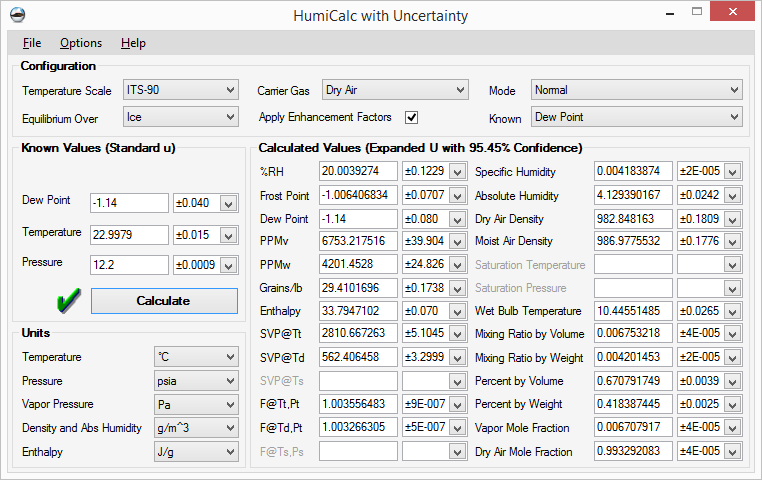
Calculate dew point value using HumiCalc®, input Known dew point, test temperature as measured by the external temperature sensor, test pressure as displayed on the 2500 screen. Humidity value as calculated from the measured dew point.
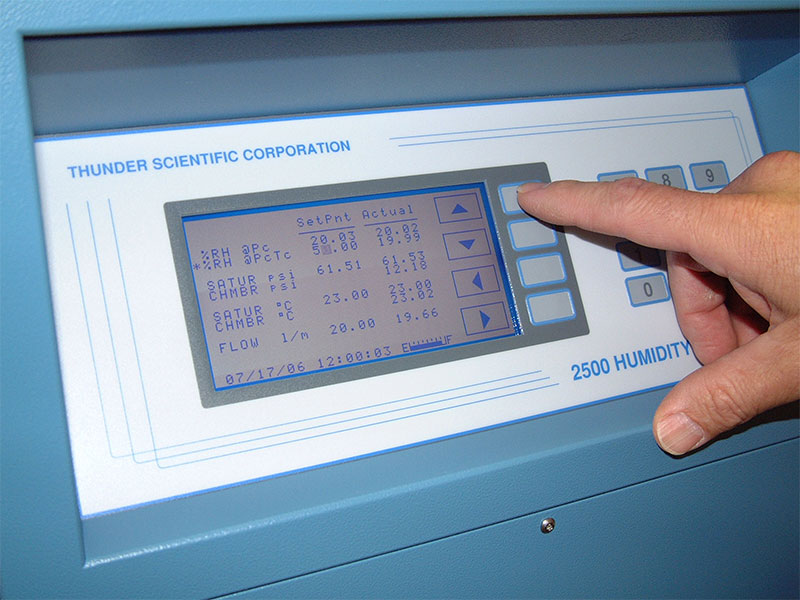
Press the CHNG SETP key. Change the %RH value to 50.0 %RH on the 2500 control screen, press ENTER. Allow the system to stabilize for 30 minutes.
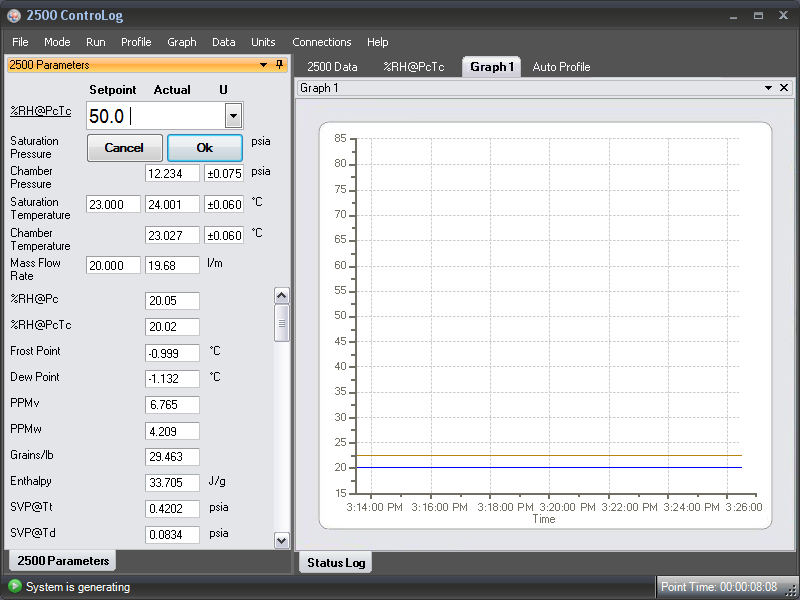
Select %RH set point, change the value to 50.0 %RH or change the set point value on the 2500 control screen to 50.0 %RH. Allow the system to stabilize for 30 minutes.
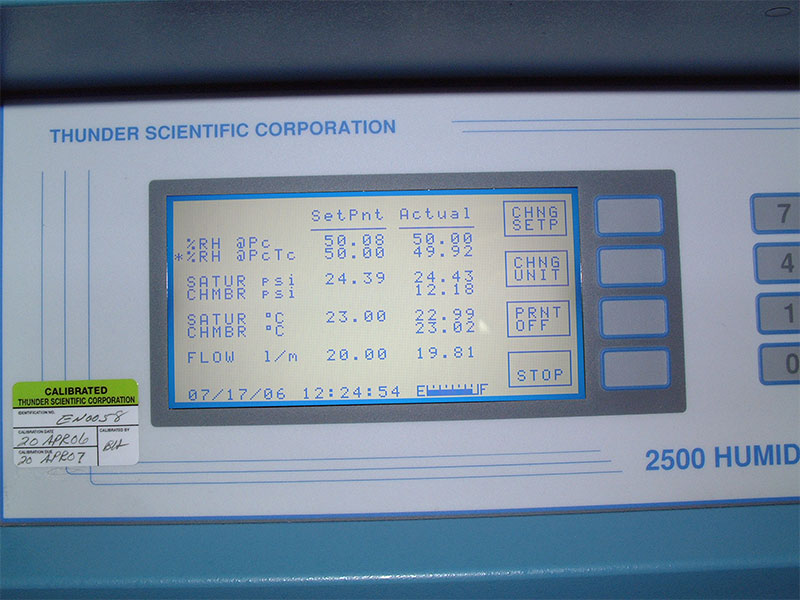
The 2500 display screen is stable at 50.0 %RH at a test temperature of 23.0 °C.
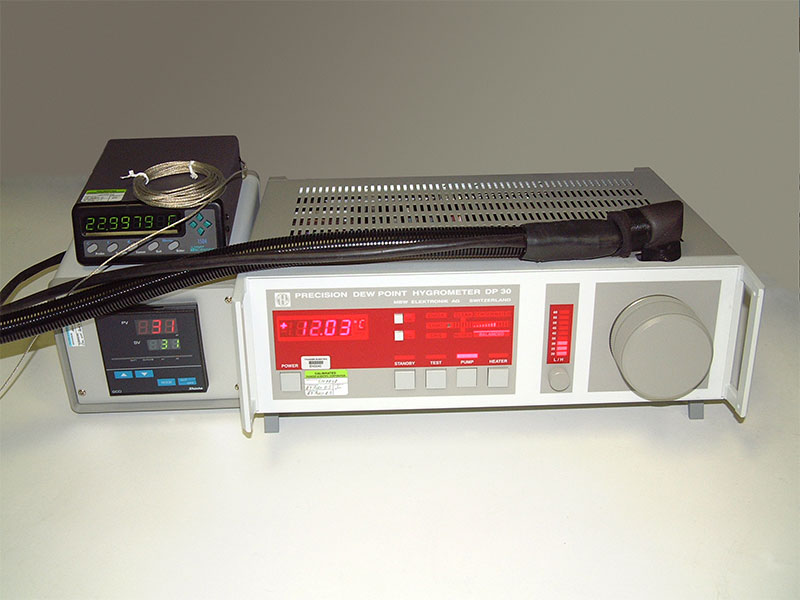
Dew point standard displays a stable dew point measurement at 50.0 %RH.
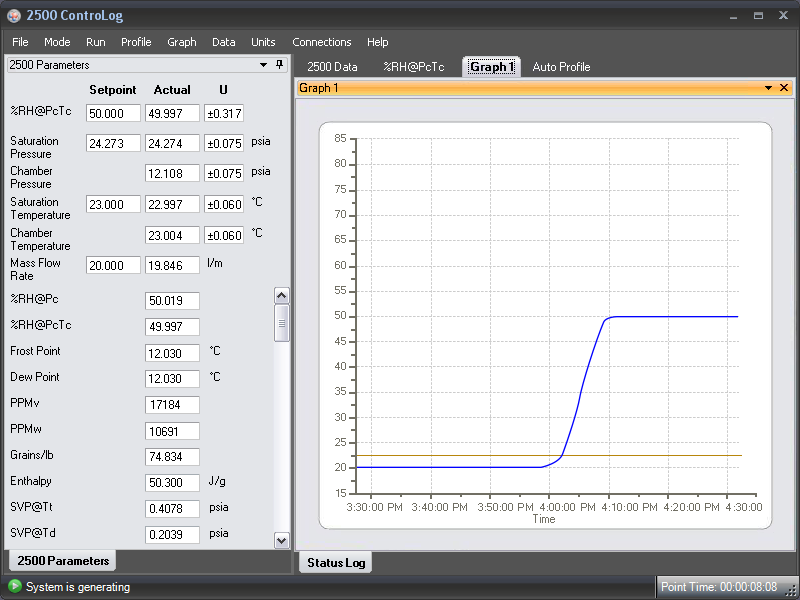
ControLog® graph displays a stable test temperature of 23.0 °C at 50.0 %RH, note the calculated dew point value.
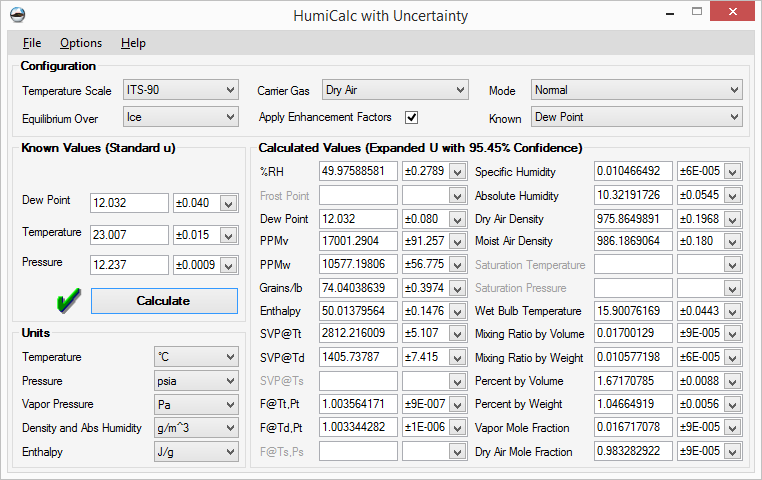
Calculate dew point value using HumiCalc®, input Known dew point, test temperature as measured by the external temperature sensor, test pressure as displayed on the 2500 screen. Humidity value as calculated from the measured dew point.
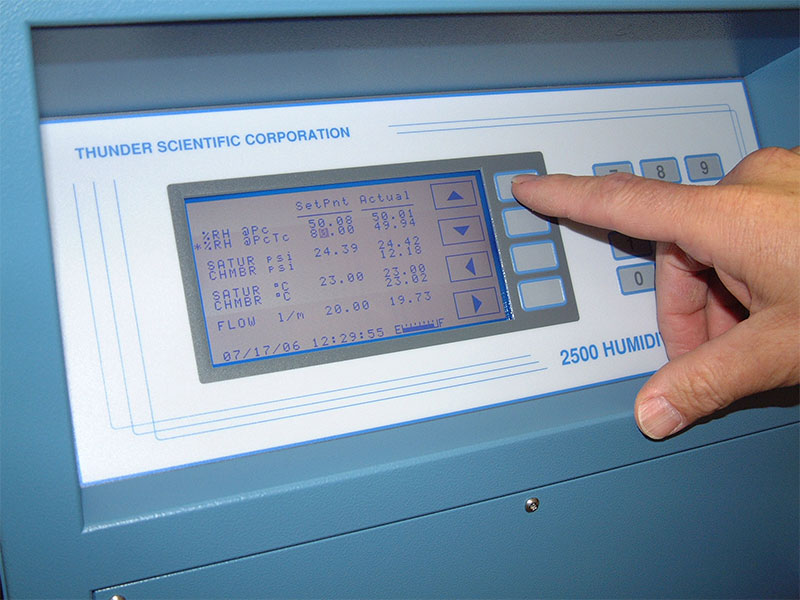
Press CHNG SETP key. Change the %RH value to 80.0 %RH on the 2500 control screen, press ENTER. Allow the system to stabilize for 30 minutes.
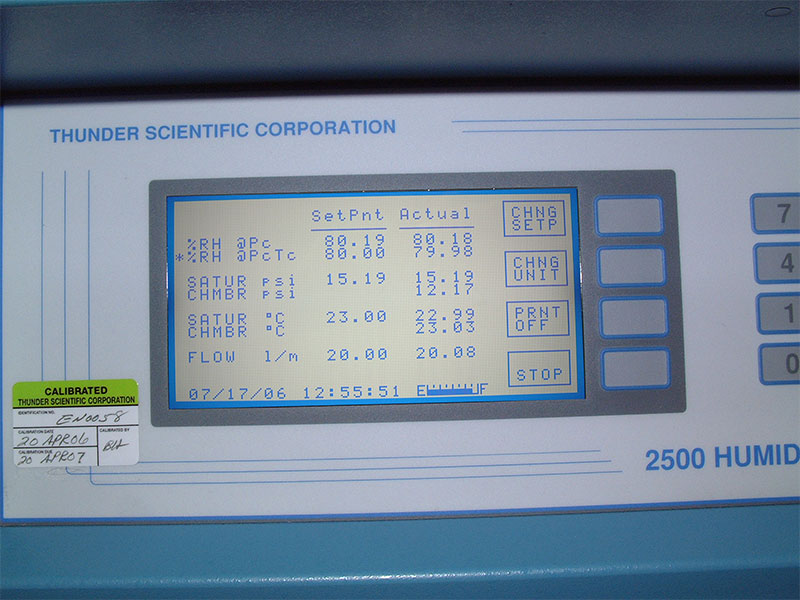
2500 display screen stable at 80.0 %RH at a test temperature of 23.0 °C.
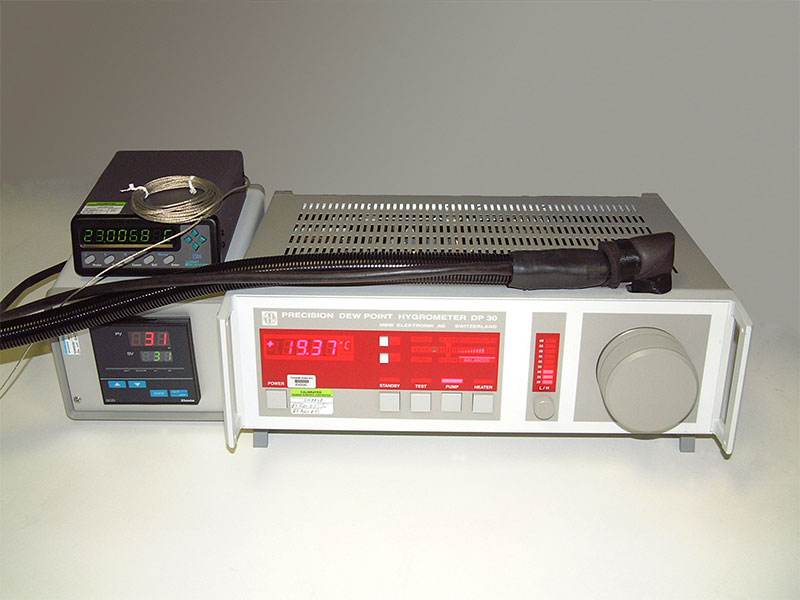
Dew point standard displays a stable dew point measurement at 80.0 %RH.
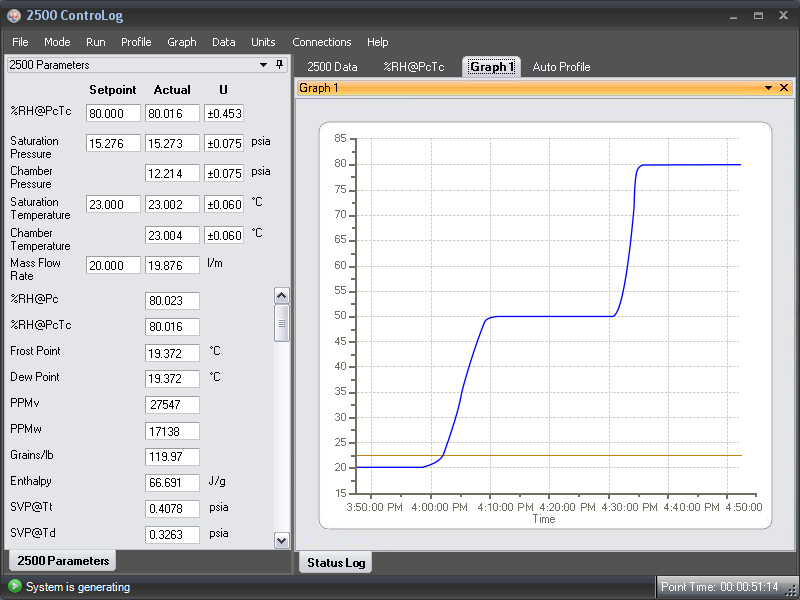
ControLog® graph displays a stable test temperature of 23.0 °C at 80.0 %RH, note the calculated dew point value.

Calculate dew point value using HumiCalc®, input Known dew point, test temperature as measured by the external temperature sensor, test pressure as displayed on the 2500 screen. Humidity value as calculated from the measured dew point.
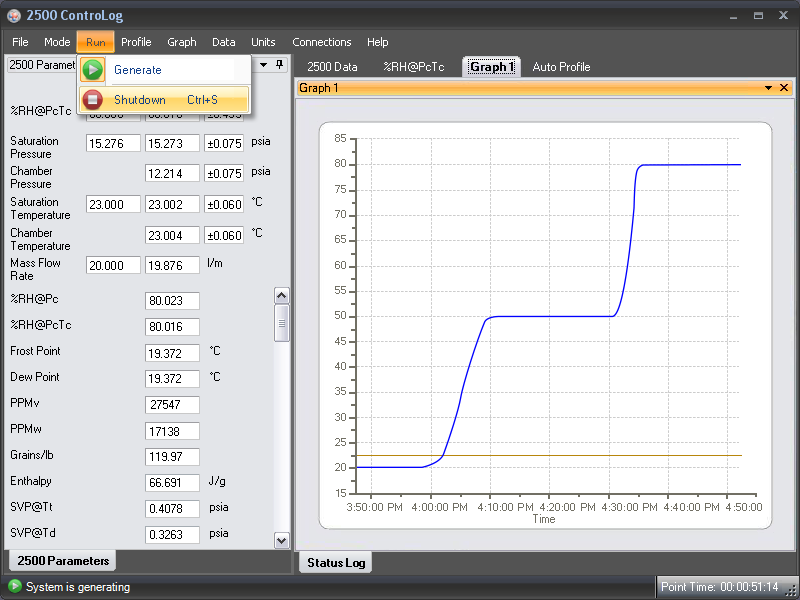
Select the RUN menu and click on Shutdown to end the calibration comparison. Save the 2500 data to a proper file, or press stop to shutdown the 2500.
Calibration – Pressure Transducers
- Proper calibration of the pressure transducers is critical to the accuracy of the generated humidity.
- Low – Pressure (0-50 PSIA) Accuracy of the calibration source should be ±0.025 PSIA.
- High – Pressure (50-150 PSIA) Accuracy of the calibration source should be ±0.10 PSIA.
- Calibration of the transducers is performed in the system as a system. Calibration coefficients are calculated automatically by the 2500 embedded computer and stored in memory with the date of the most recent calibration.
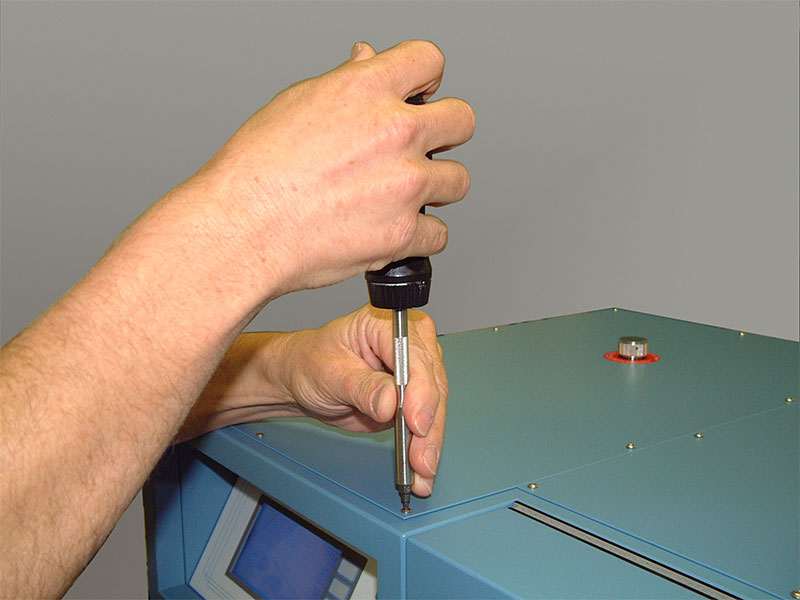
Disconnect AC power from the 2500 system before removal of the panels. First remove the reservoir fill cap before removing the top left panel. Use a #10 Torx driver to remove the panels.
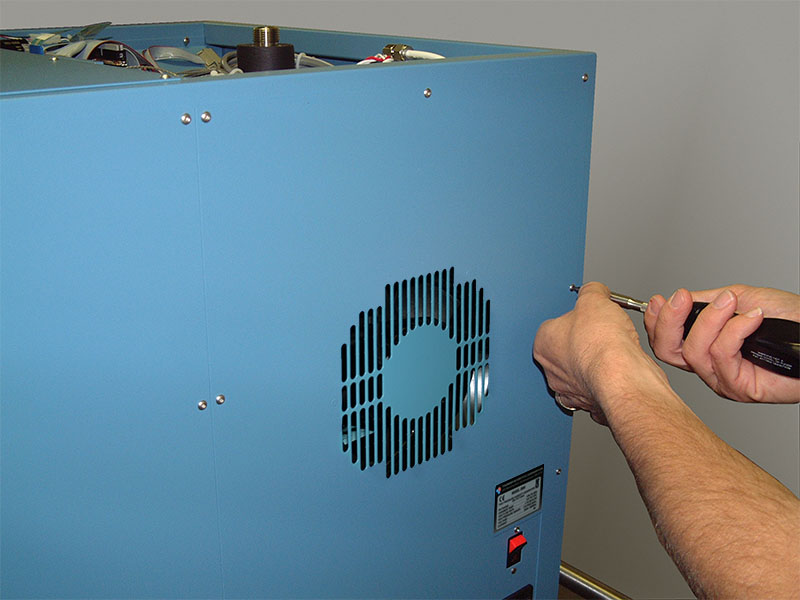
When removing the right rear cover, pay close attention to the fan cord plug, it must be removed before pulling the panel away. This will allow access to the low and high pressure transducers.
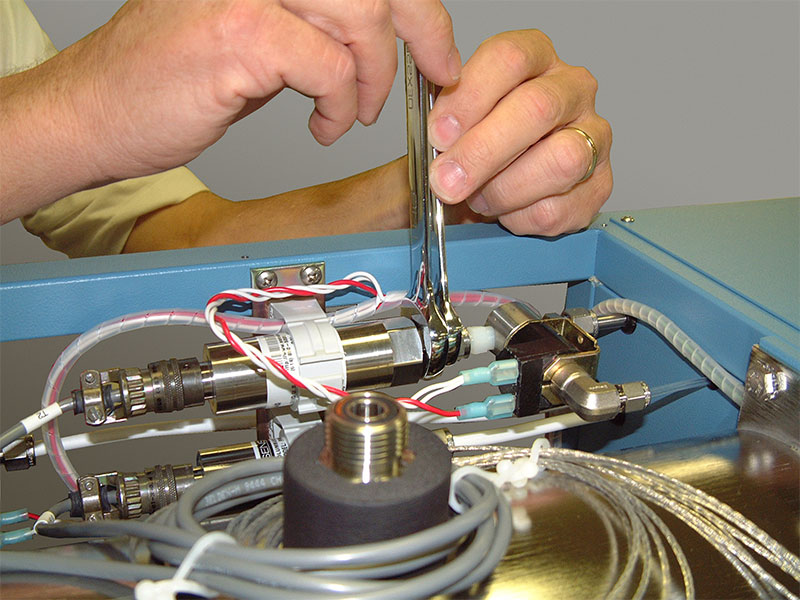
Remove the low pressure transducer as identified as T2 using a 9/16” and 11/16" wrench set.
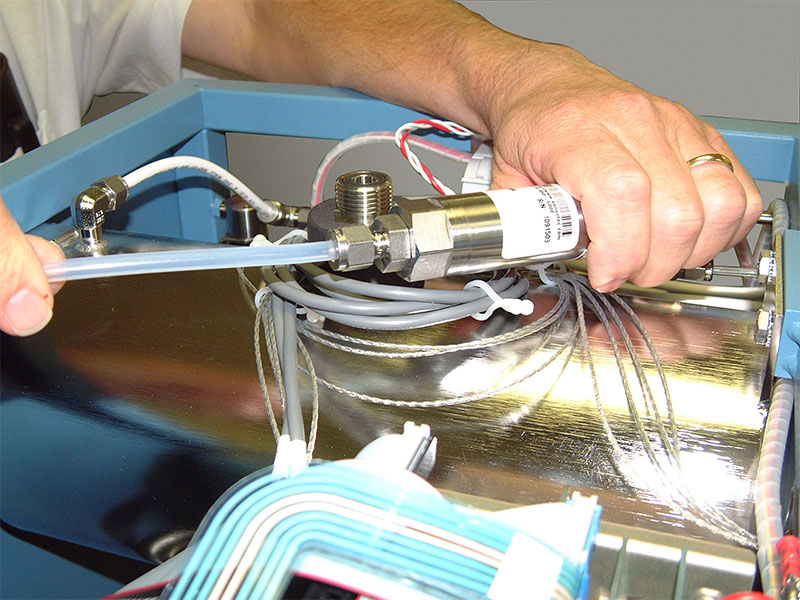
Connect the low pressure transducer to the calibration air source.
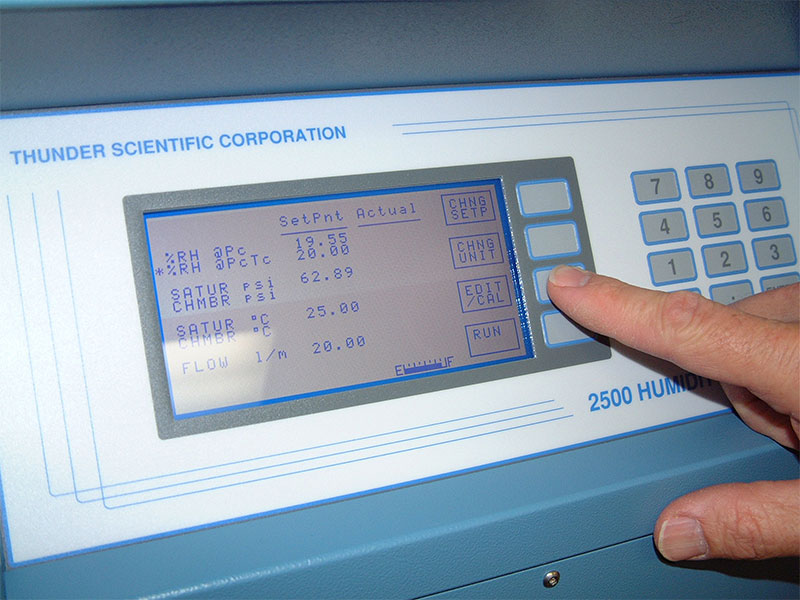
Power on the 2500 and allow the system to stabilize for 30 minutes.
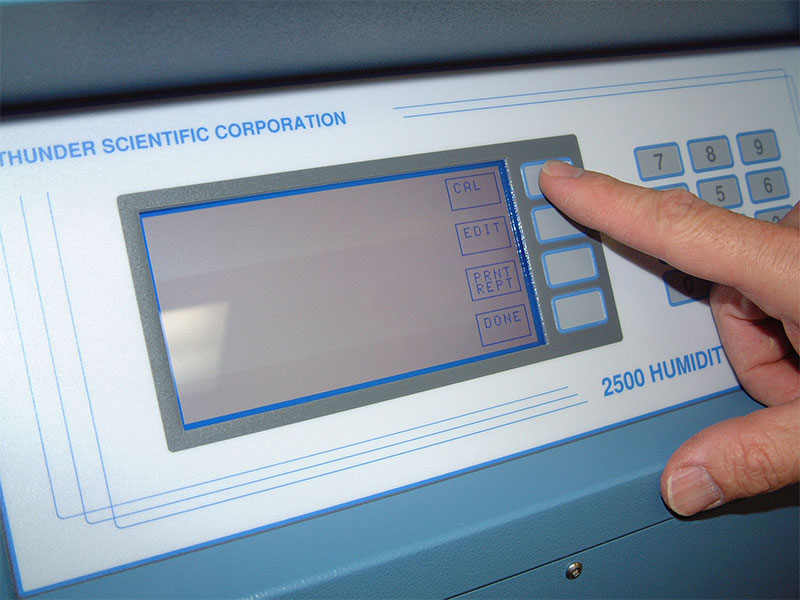
Press CAL, the calibration menu is displayed.
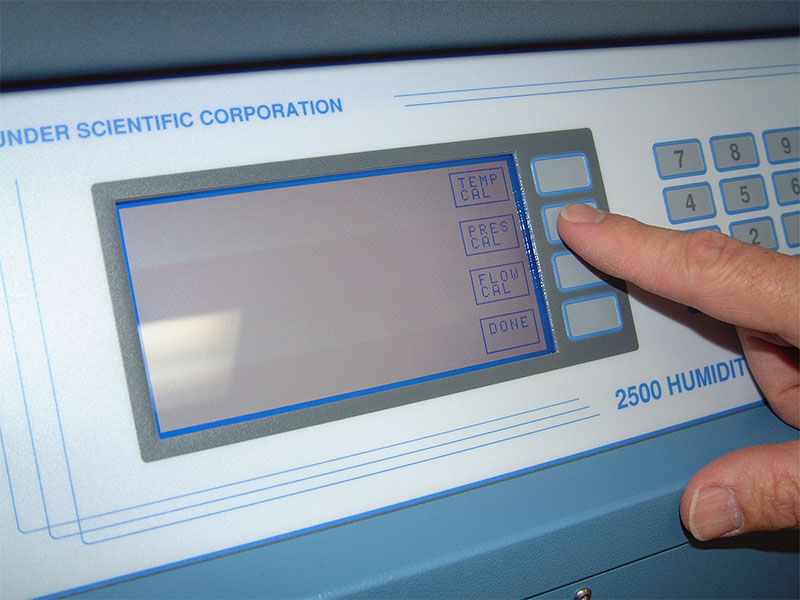
Press the PRES CAL key.
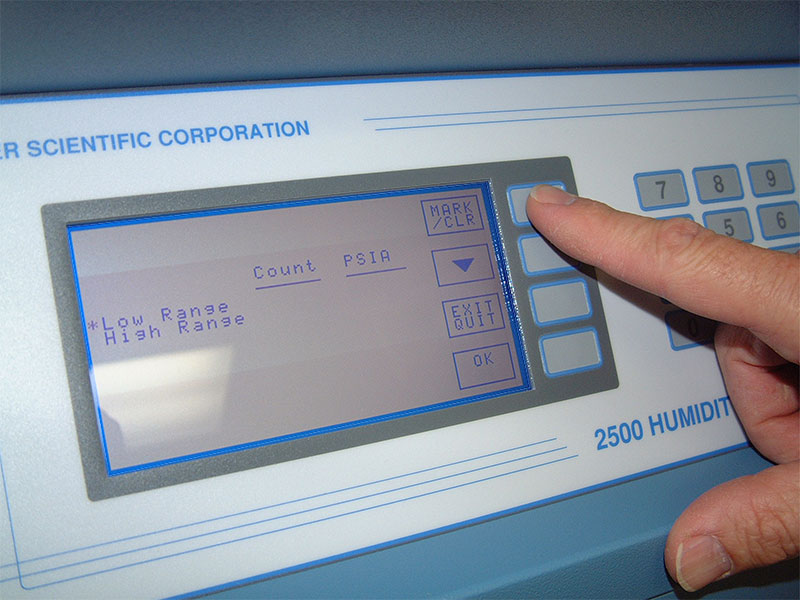
Using the MARK/CLR key mark the low range transducer for calibration, a marked transducer is indicated with an asterisk in the left column.
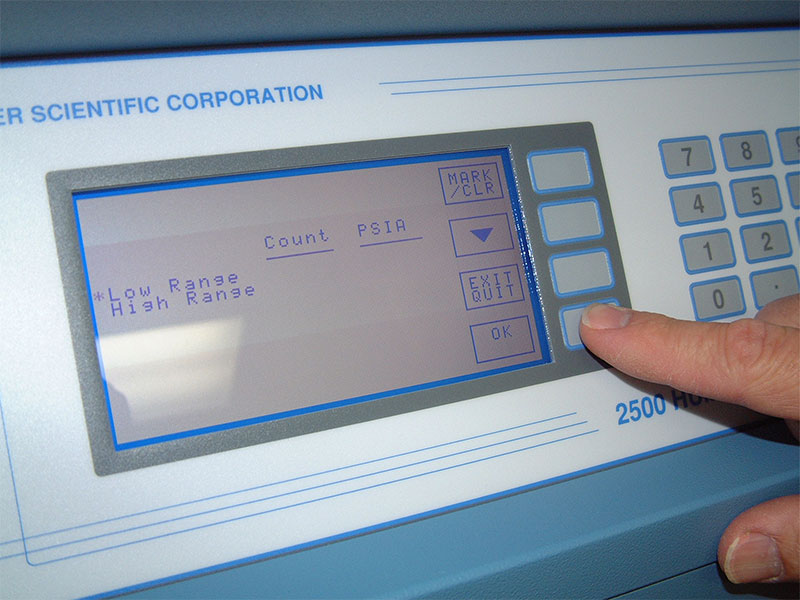
Press OK, if a mistake was made press EXIT QUIT.
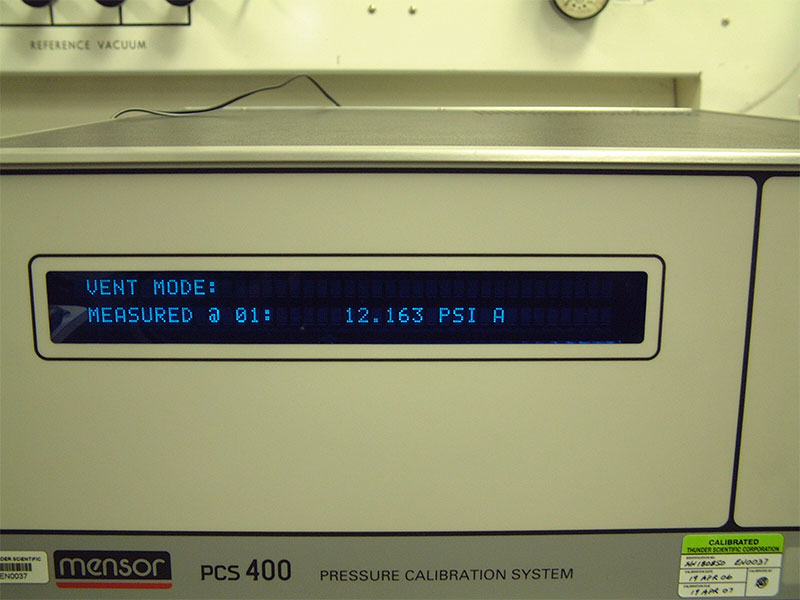
The first calibration point will be ambient test pressure as displayed on the calibration source, press LOW PRES key and enter the reference pressure then press ENTER.
If a mistake is made during the pressure entry press the OOPS to cancel the entry.
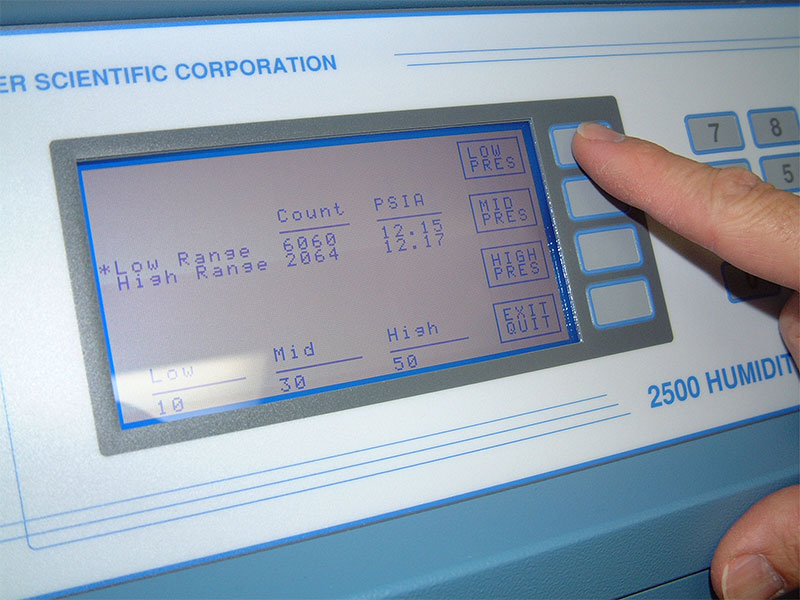
Press the LOW PRES key.
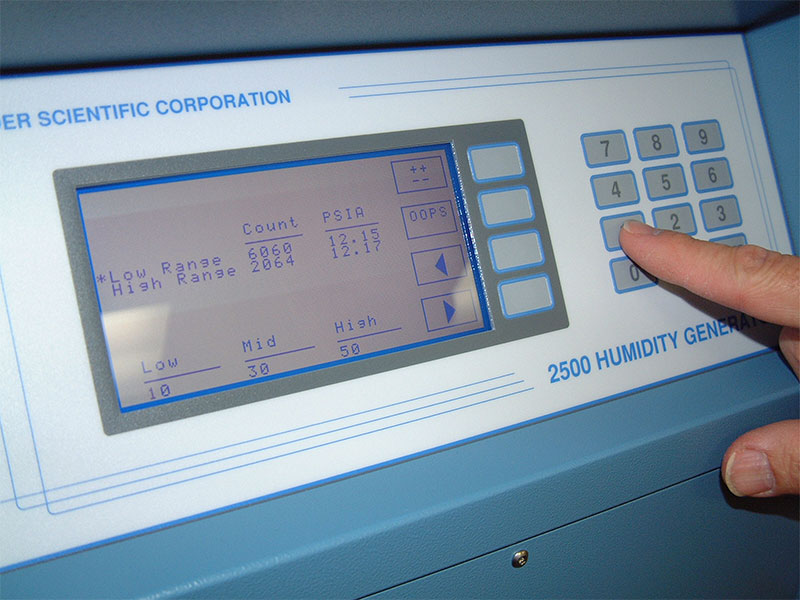
Enter the reference pressure.
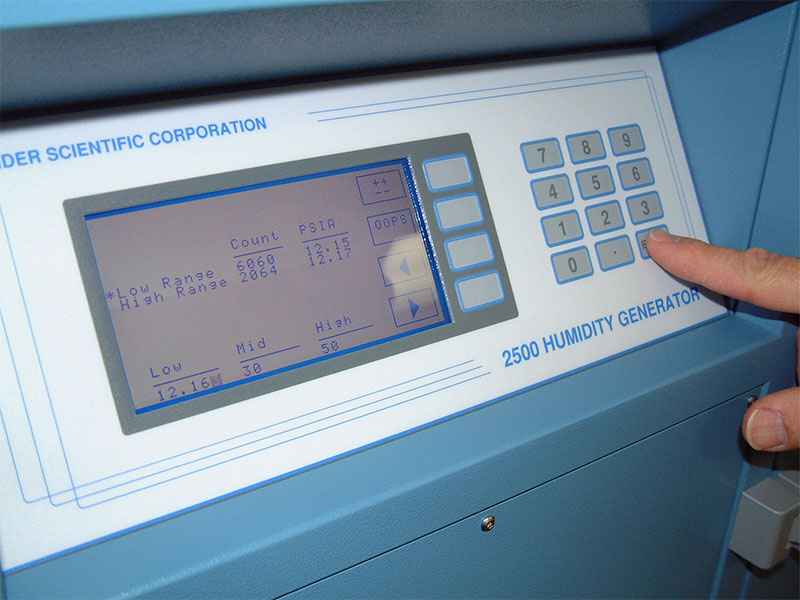
Press ENTER. Note the Low value as entered for the low pressure.
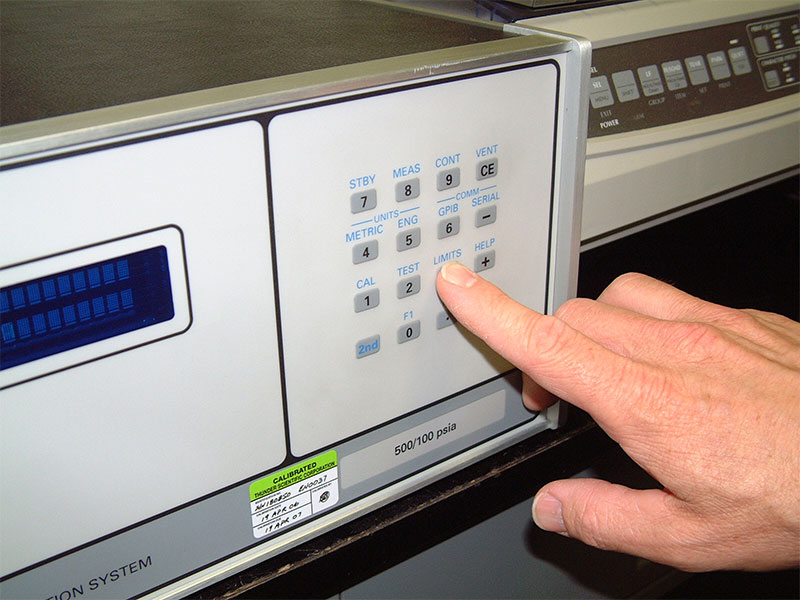
Apply the mid range pressure calibration point of 30.000 PSIA, wait 5 minutes for stabilization.
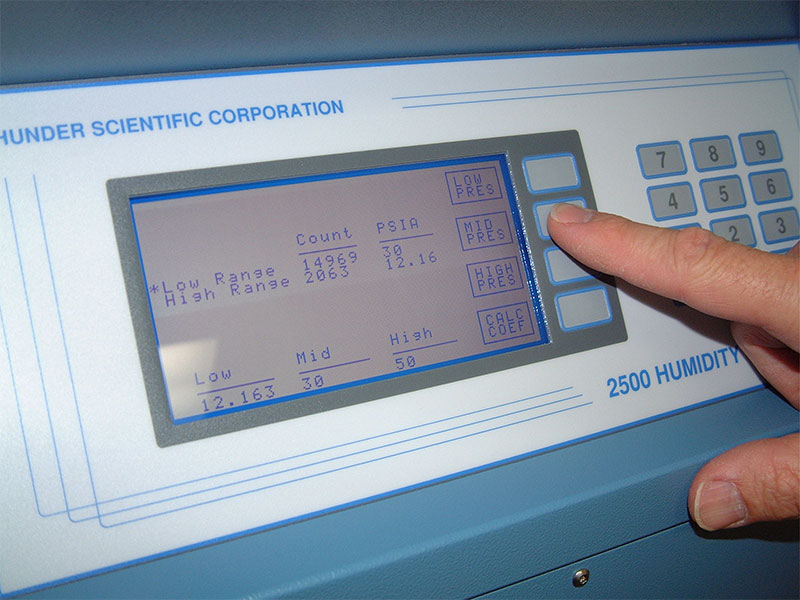
Press MID PRES key and enter the reference pressure, then press ENTER.
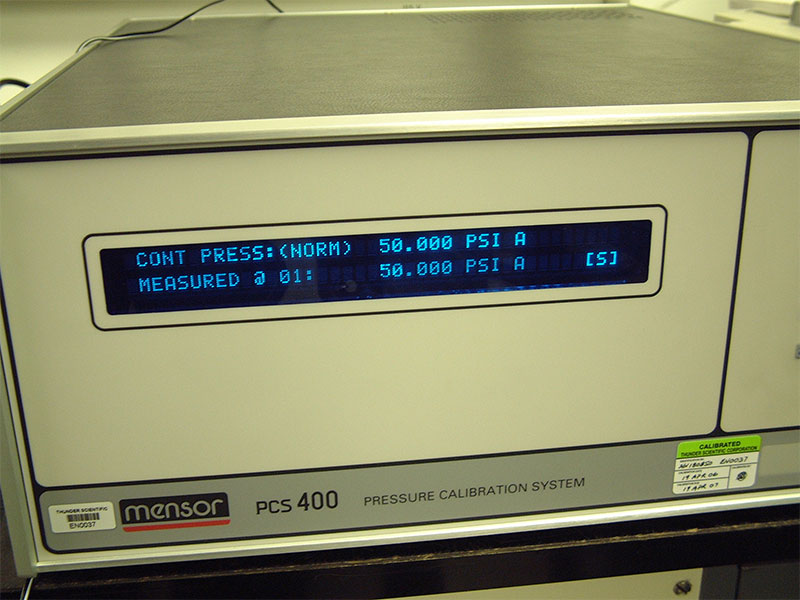
Apply the high pressure calibration point of 50.000 PSIA, wait 5 minutes for stabilization.
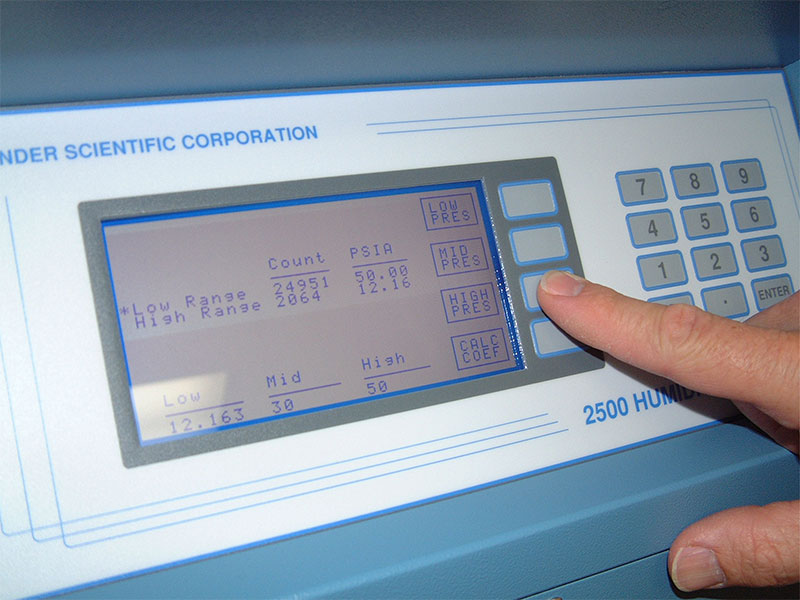
Press HIGH PRES key and enter the reference pressure, press ENTER.
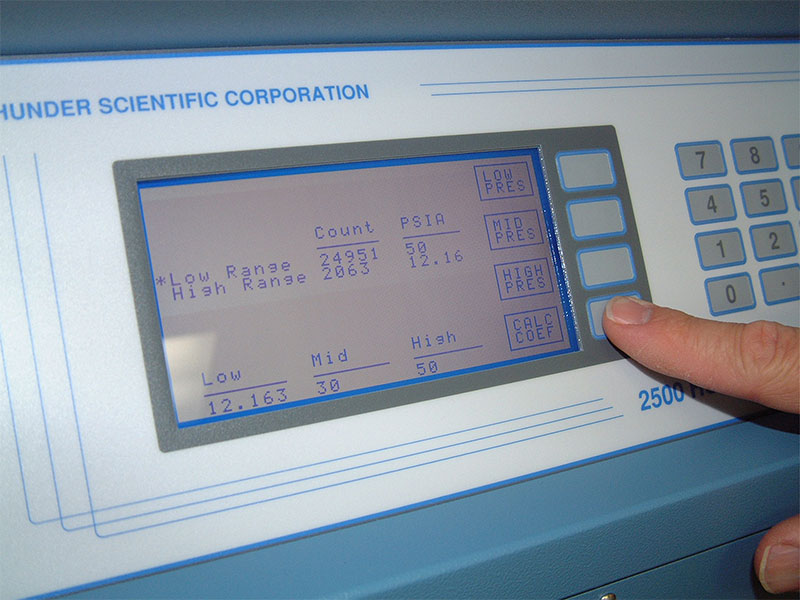
Press CALC COEF key. All coefficients for the marked transducer will be calculated and displayed on the 2500 calibration screen.
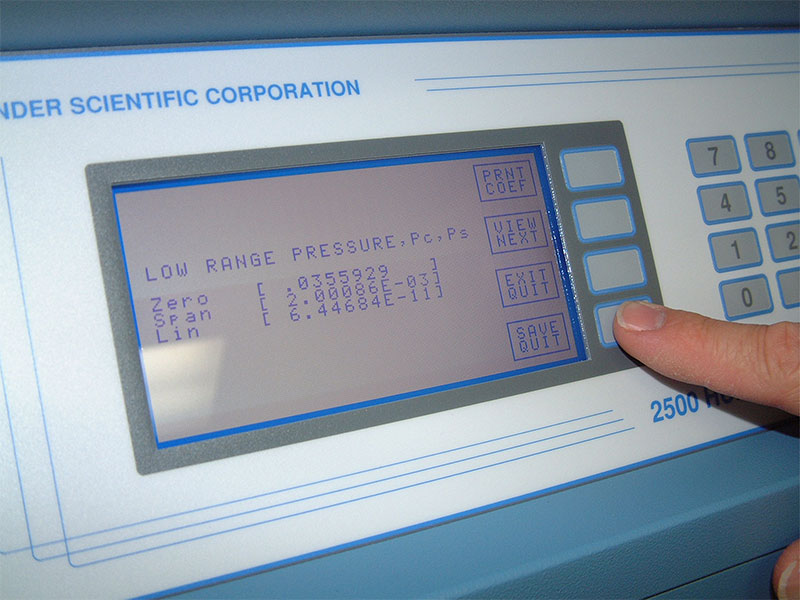
Press SAVE QUIT key, the coefficients will be stored to non-volatile memory.
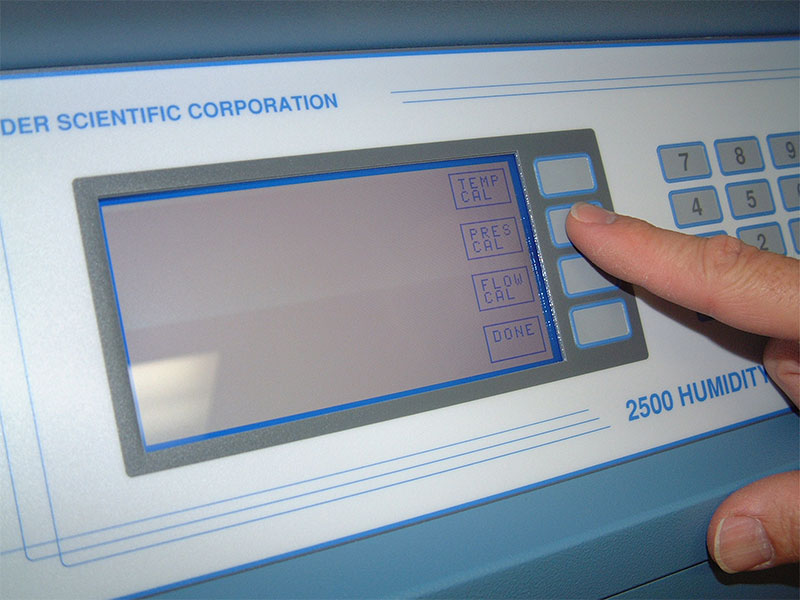
Press PRES CAL retest as left calibration comparison with the pressure source at ambient test pressure, 20.00, 30.00, 40.00, & 50.00 PSIA test points. Press EXIT QUIT key.
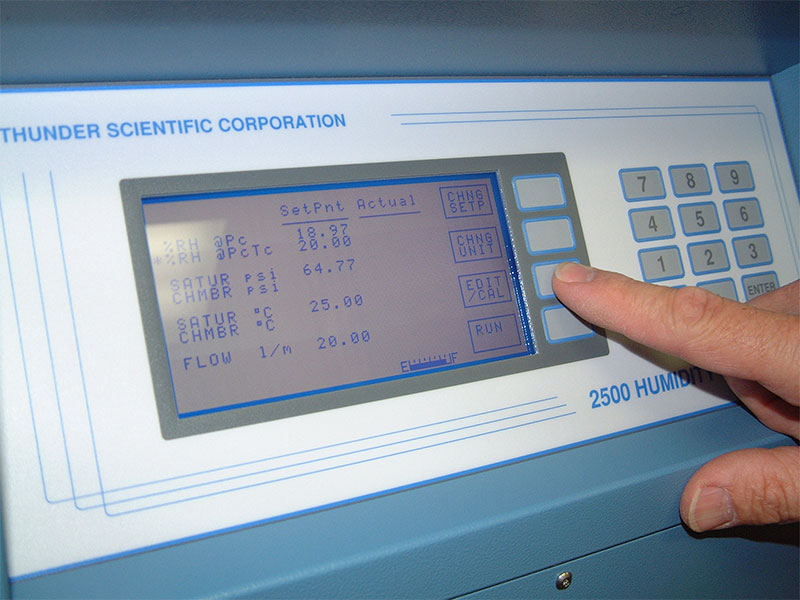
Press the EDIT / CAL key, press CAL, the calibration menu is displayed.
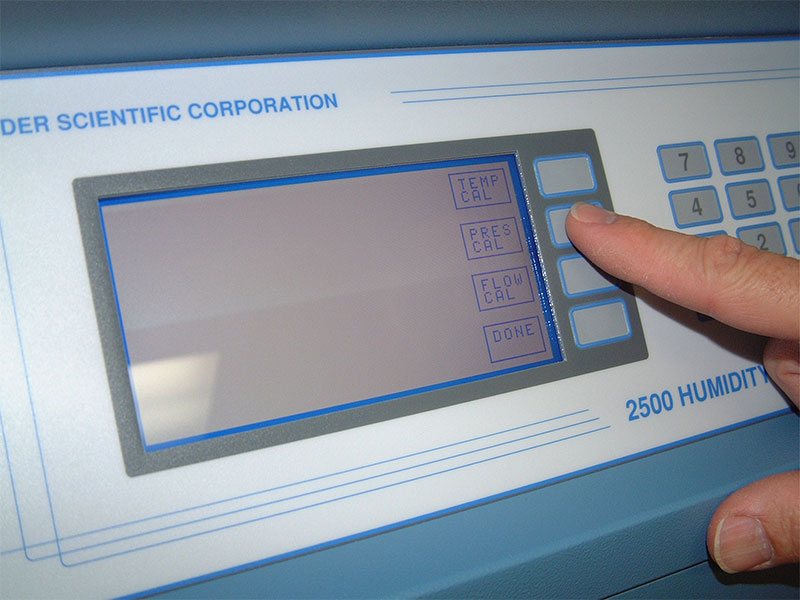
Press the PRES CAL key.
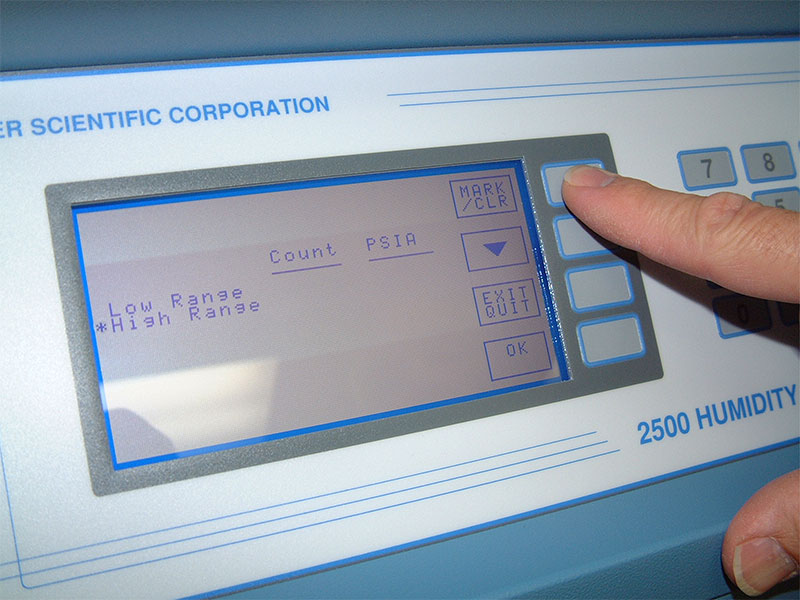
Using the MARK / CLR key and down arrow key mark the high range transducer for calibration, a marked transducer is indicated with an asterisk in left column.
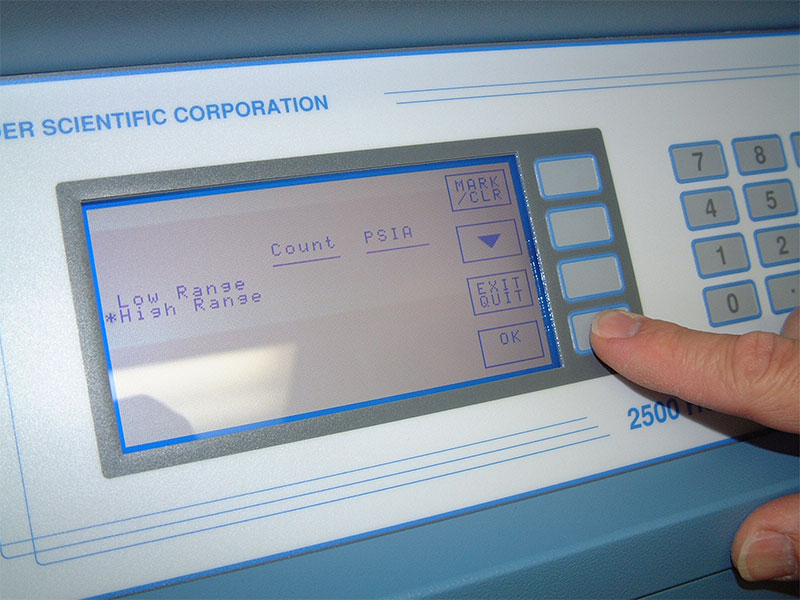
Press OK, if a mistake was made press EXIT QUIT.
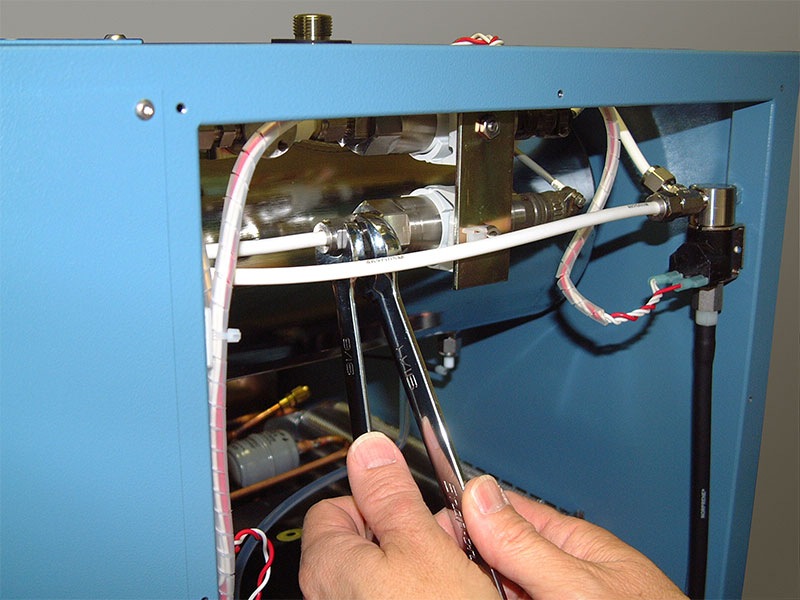
Remove the high pressure transducer as identified as T3 using a 9/16” and 11/16" wrench set.
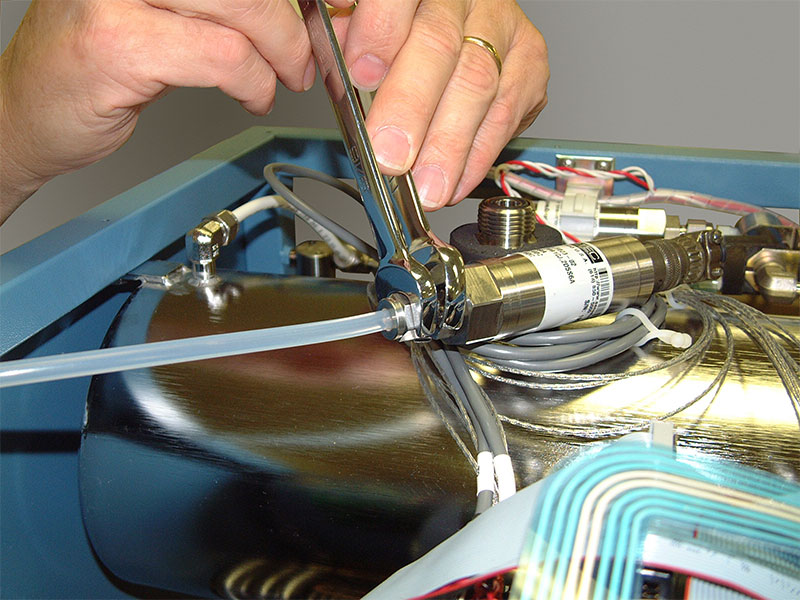
Connect the high pressure transducer to the calibration source.
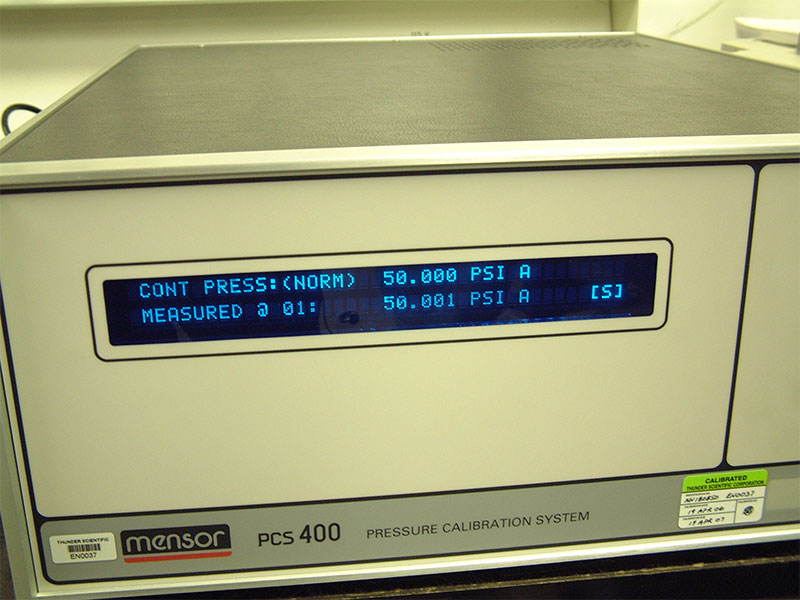
The first calibration point will be 50.000 PSIA test pressure as displayed on the calibration source, wait 5 minutes.
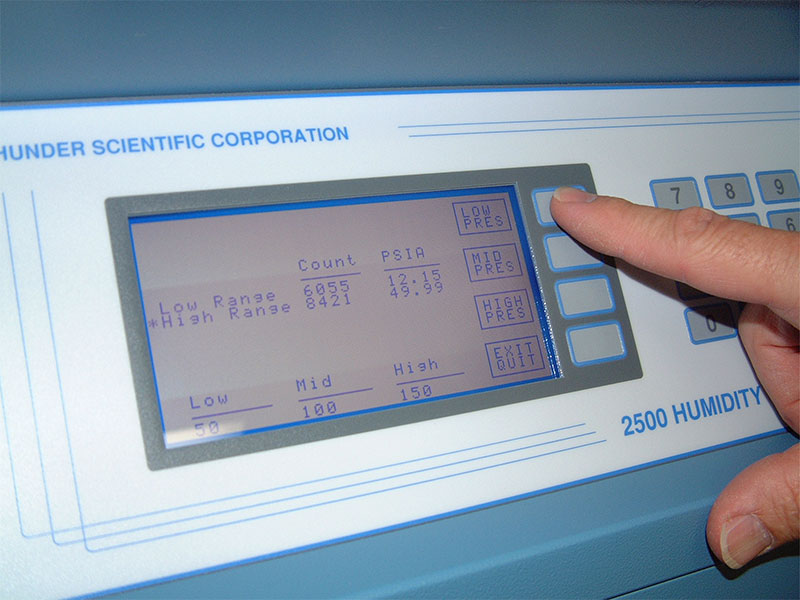
Press LOW PRES key and enter the reference pressure then press ENTER.
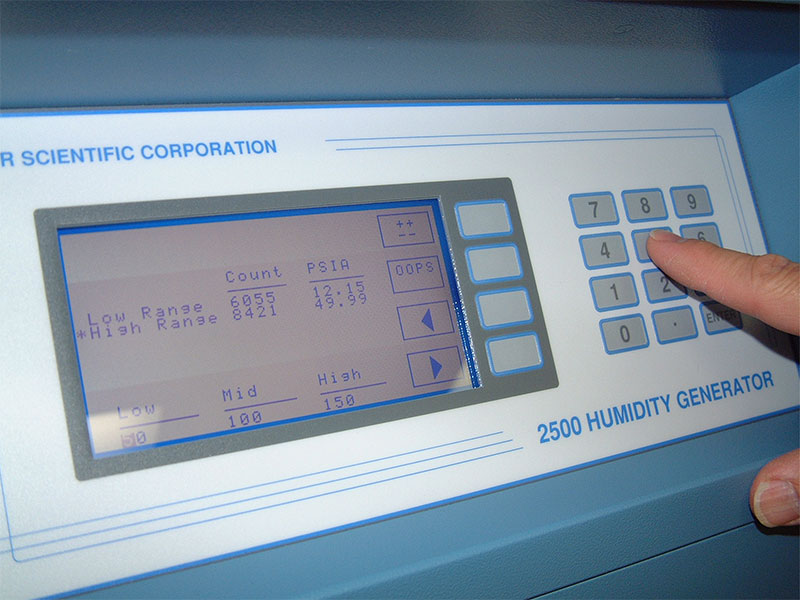
If a mistake is made during the pressure entry, press the OOPS key to cancel the entry.
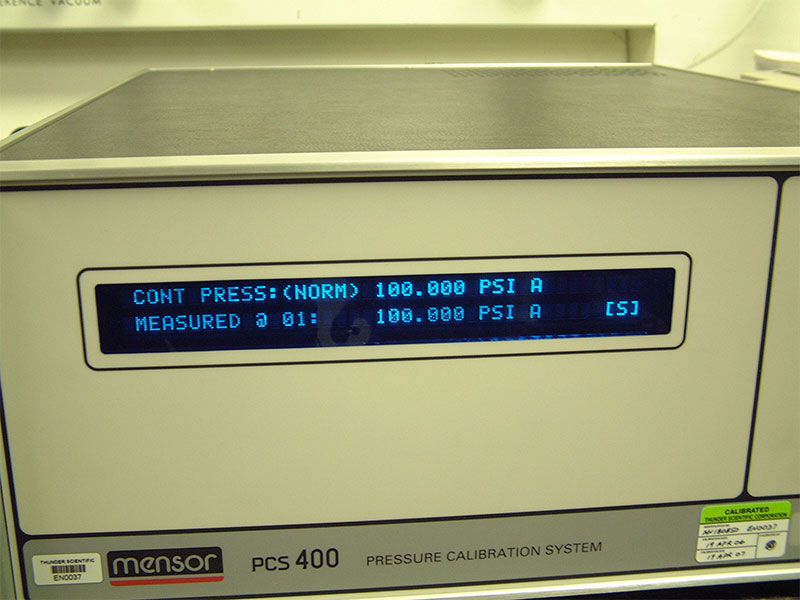
Apply the mid range pressure calibration point of 100.000 PSIA, wait 5 minutes for stabilization.
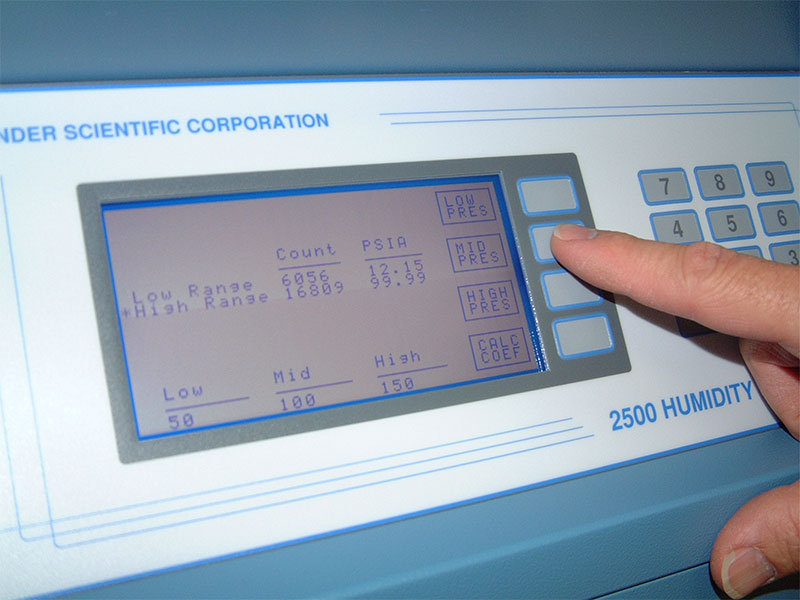
Press MID PRES key and enter the reference pressure, press ENTER.
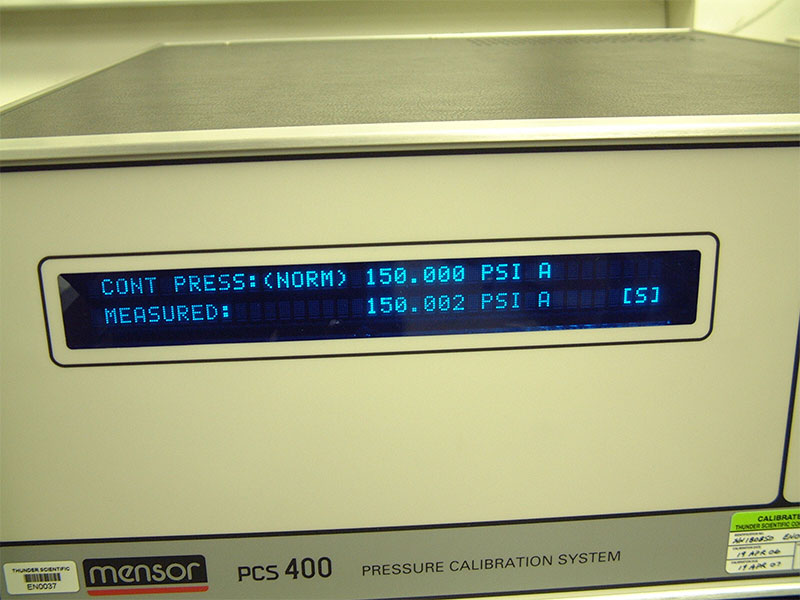
Apply the high pressure calibration test point of 150.000 PSIA, wait 5 minutes for stabilization.
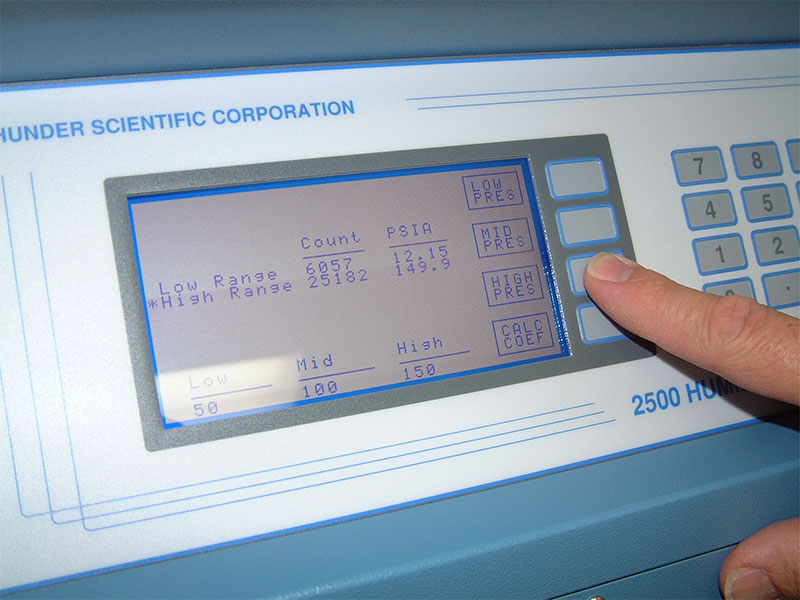
Press the HIGH PRES key and enter the reference pressure, press ENTER.
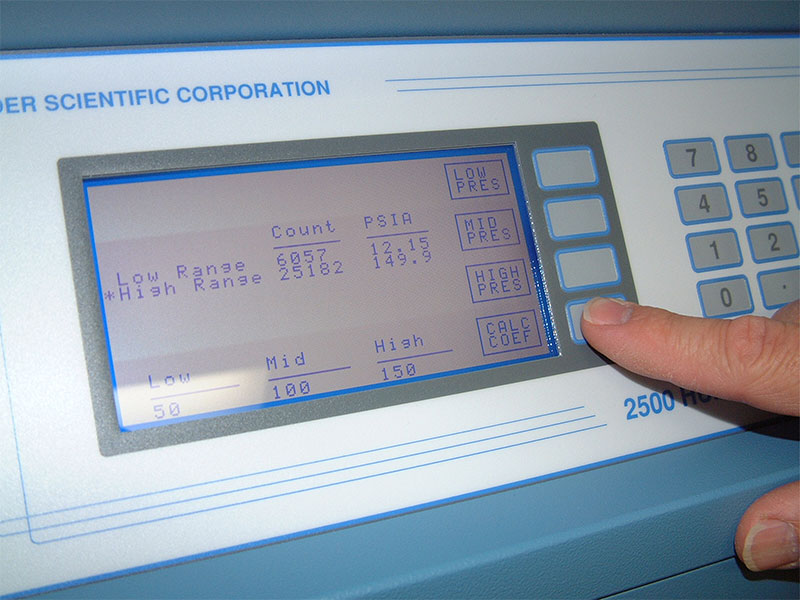
Press CALC COEF key. All coefficients for the marked transducer will be calculated and displayed on the 2500 calibration screen.
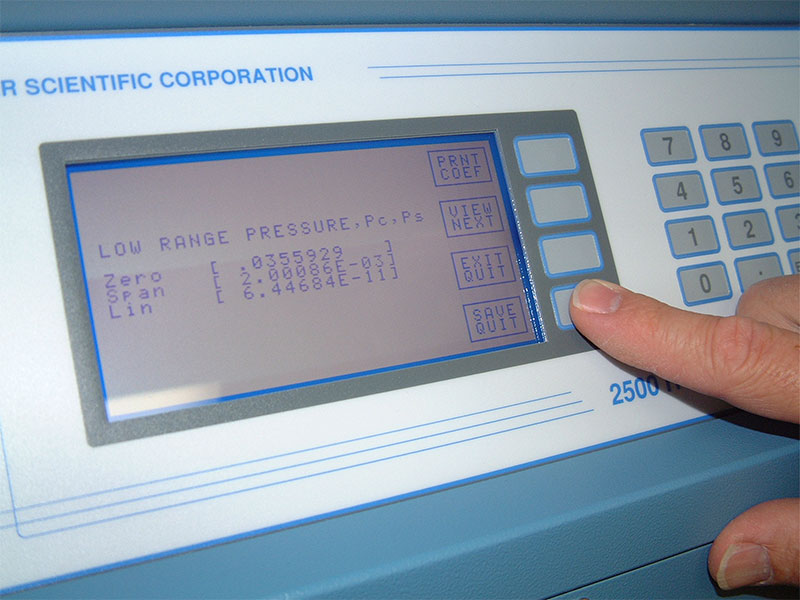
Press SAVE QUIT key, the coefficients will be stored to non-volatile memory.
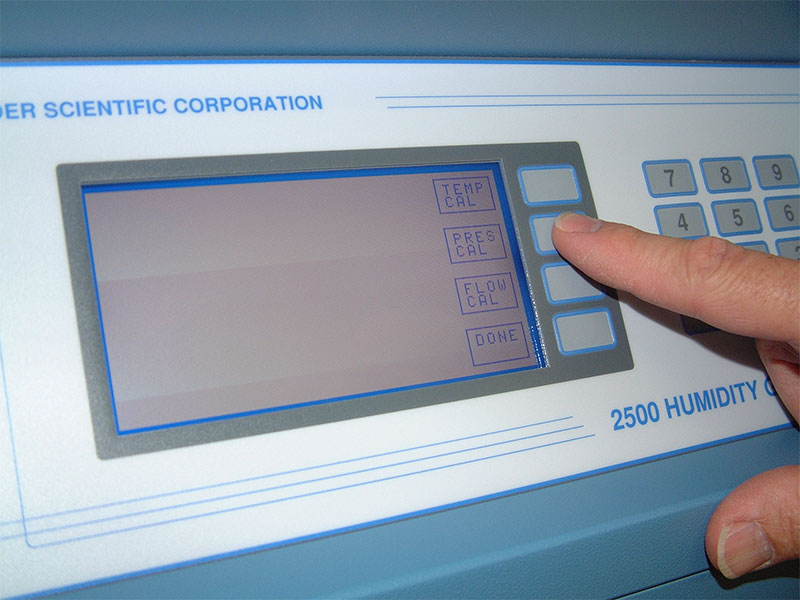
Press the PRES CAL key.
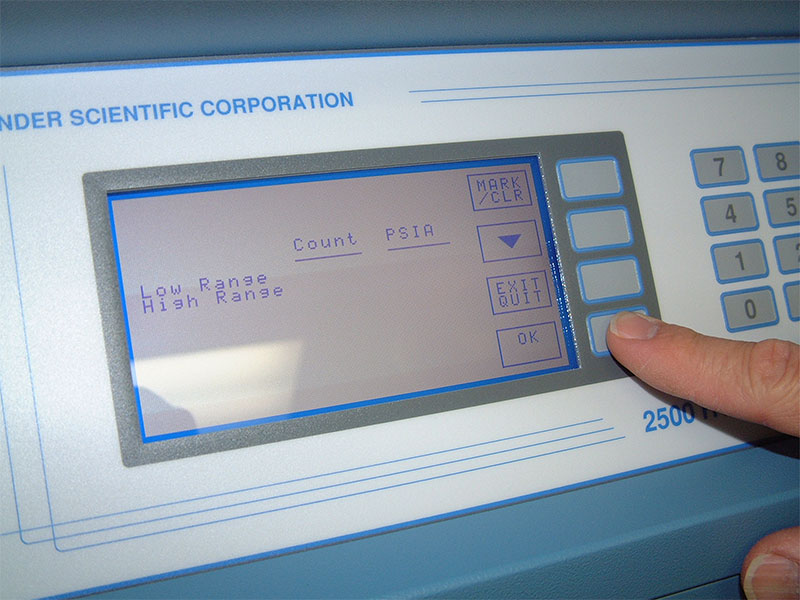
Press OK. Retest as left calibration comparison with the pressure source at 50.00, 75.00, 100.00, 125.00, & 150.00 PSIA test points.
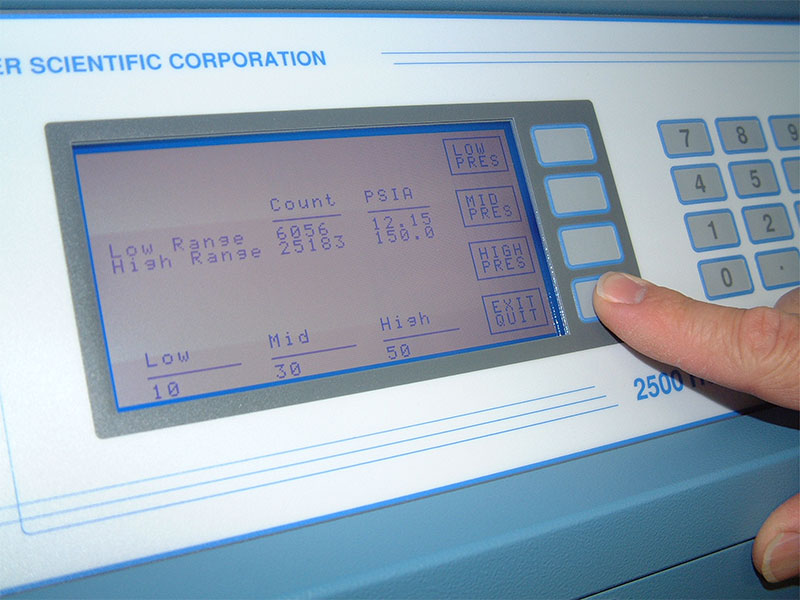
Press the EXIT QUIT key.
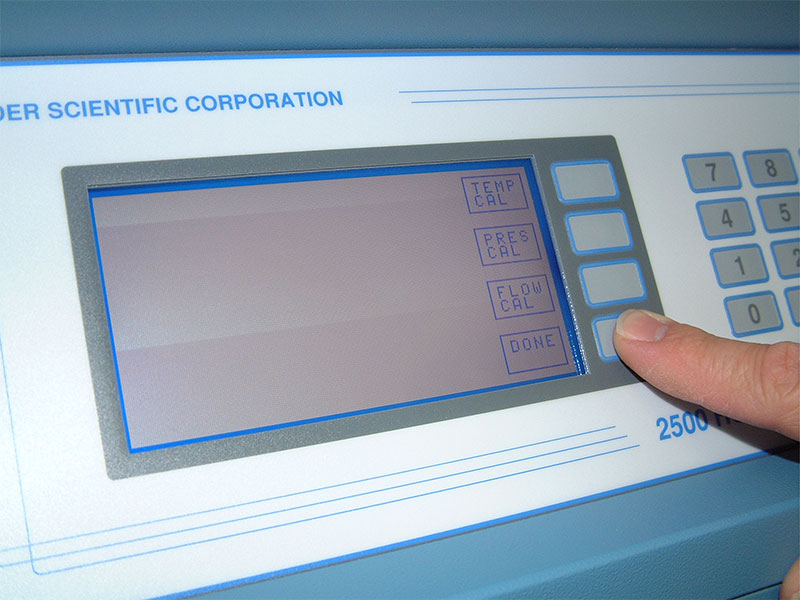
At the calibration menu press DONE, press DONE again, the system will reinitialize to the Control/Display screen.
2500 System Calibration Temperature
- Four 10KΩ thermistors are used for temperature readout and control of the 2500.
- All are easily removed for calibration.
- These are the temperature probes.
- Saturation Temperature (RTD0)
- Presaturation Temperature (RTD1)
- Expansion Valve Temperature (RTD2)
- Test Chamber Temperature (RTD3)
A small temperature circulation bath will be used for calibration of the temperature sensors over the range of 0 °C to +70.0 °C A standard reference thermometer (PRT or Thermistor) with an accuracy of ±0.03 °C will be needed.
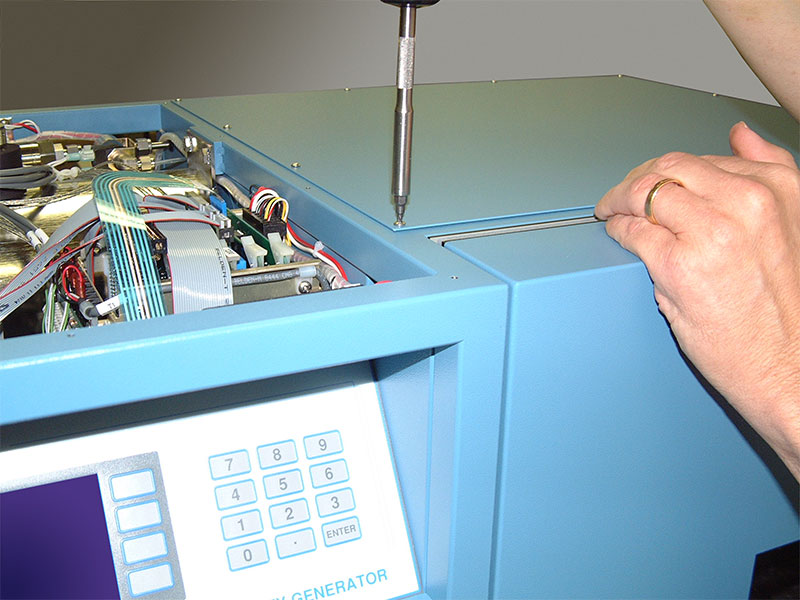
Disconnect AC power from the 2500 system before removal of the panels, using a #10 Torx driver remove the top right cover.
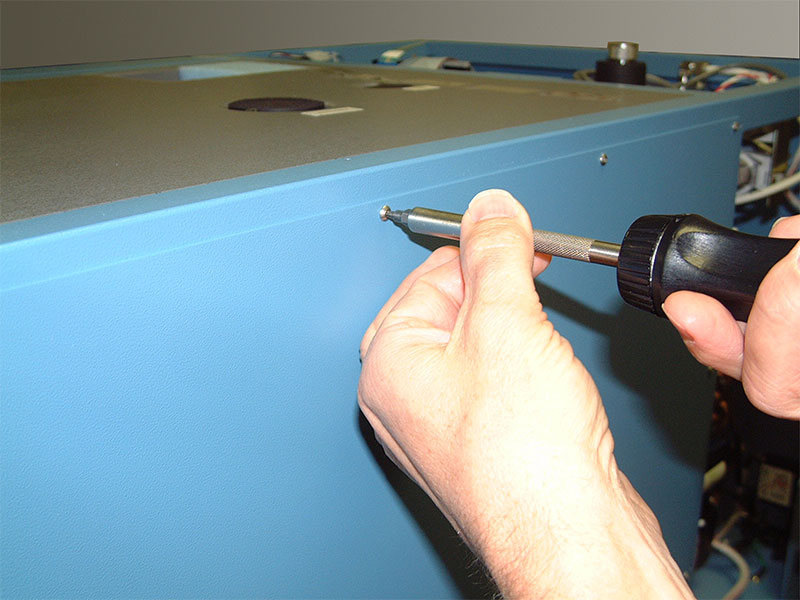
Next remove the left rear cover for access to the temperature sensors.
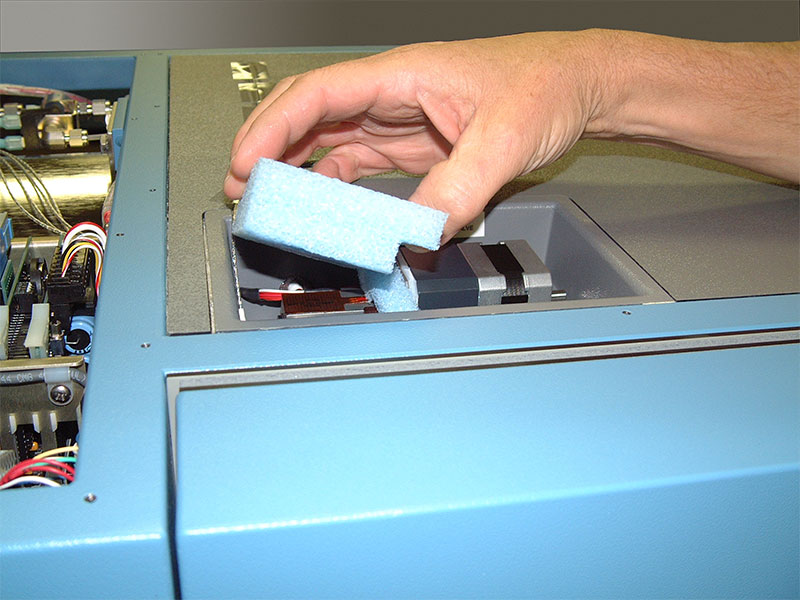
Remove insulation material from the expansion valve box.
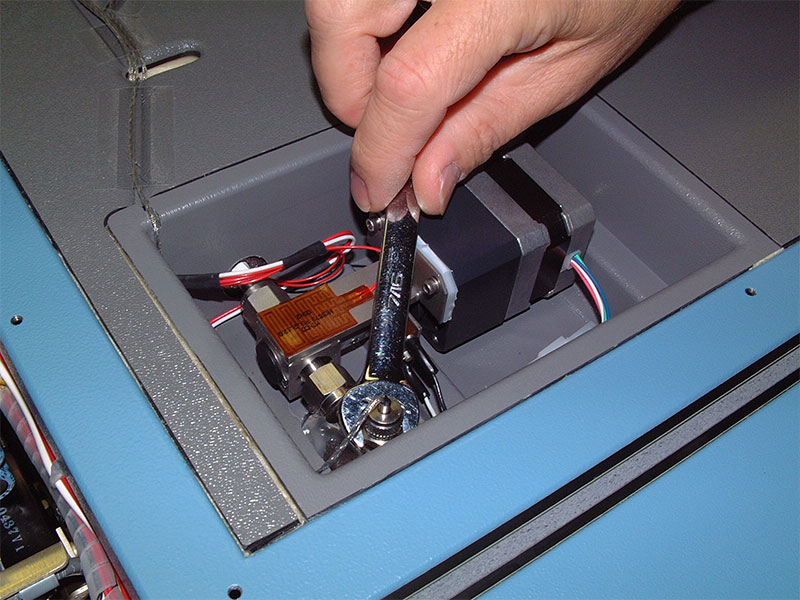
Loosen the 7/16“ probe fitting for RTD2.
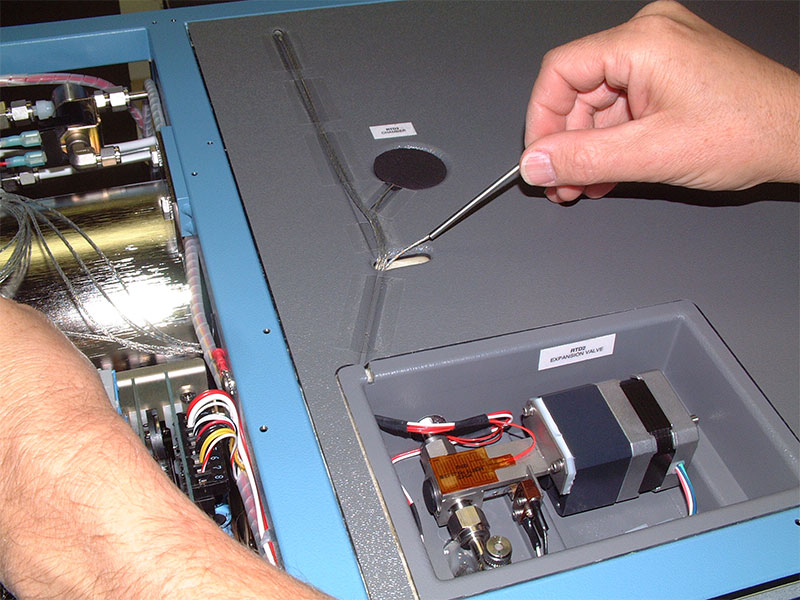
Remove the expansion valve temperature sensor (RTD2), sliding it thru the bulkhead wall.
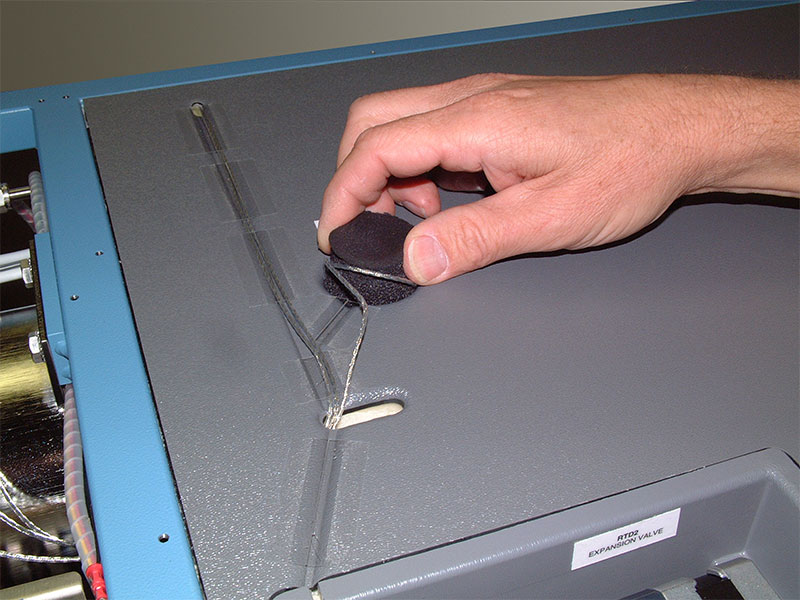
Remove the insulation material from the chamber temp probe location.
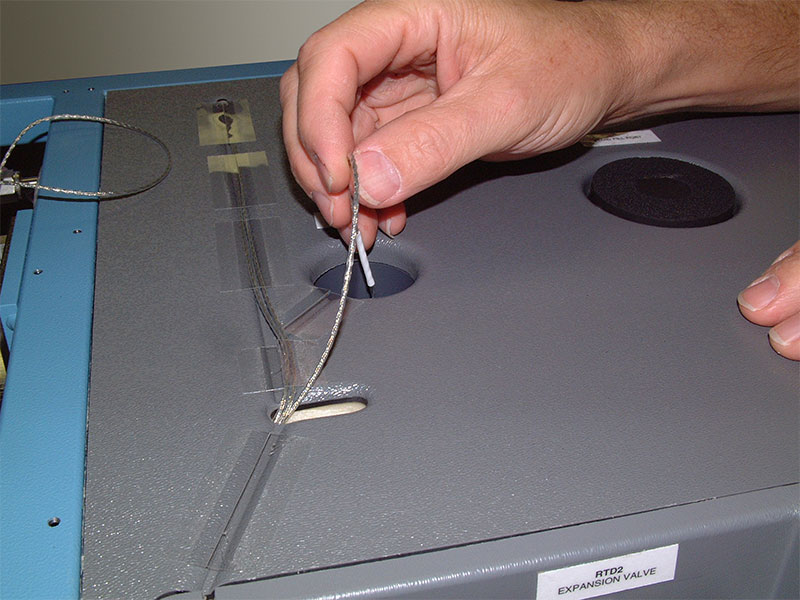
Remove the chamber temperature sensor (RTD3).
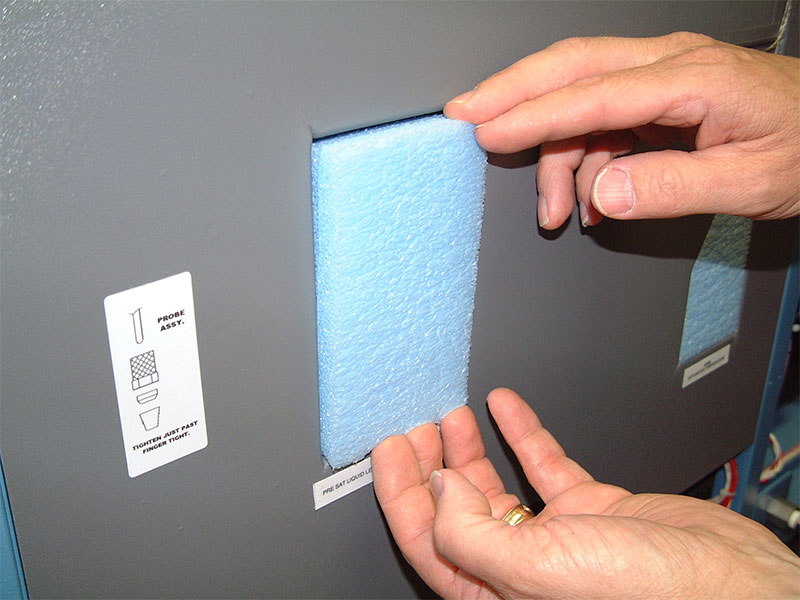
Remove the insulation material from the back panel location labeled RTD1 Presaturation.
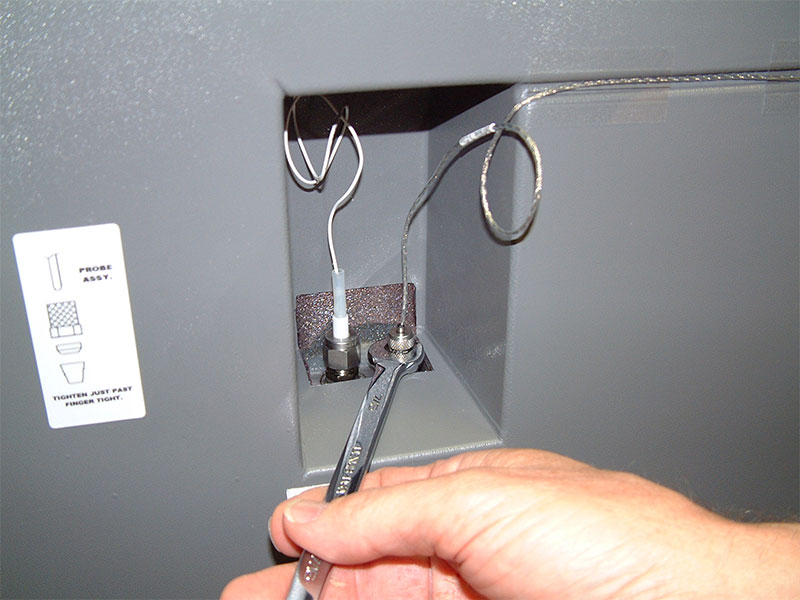
Loosen the 7/16” probe fitting for RTD1.
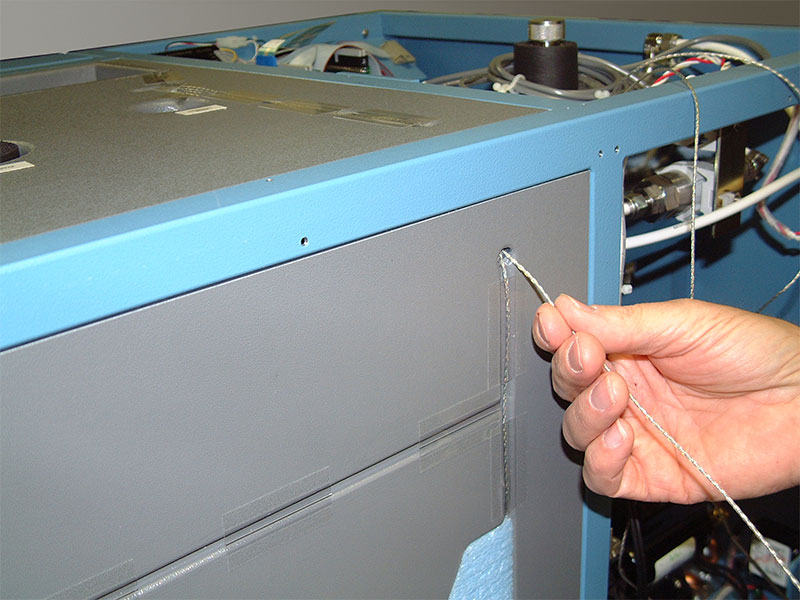
Remove the pre-saturation temperature sensor (RTD1).
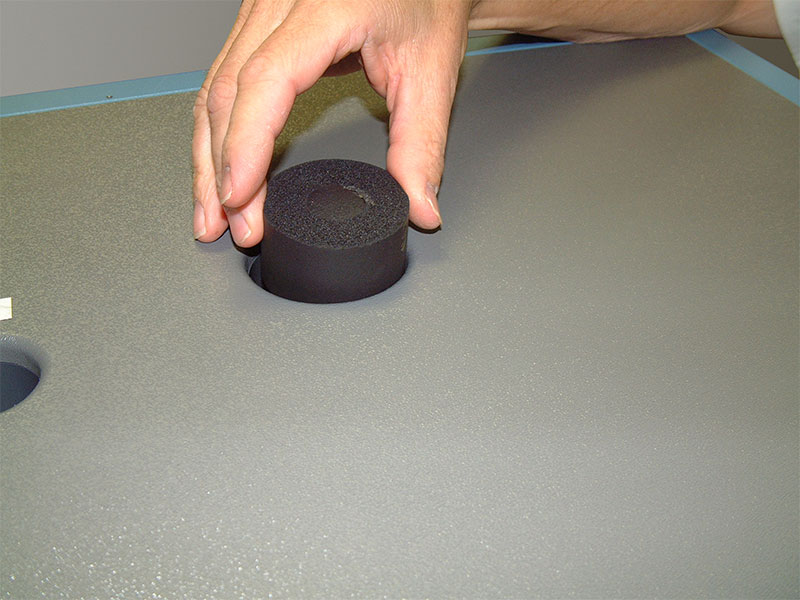
Remove the insulation material from the chamber fluid fill port.
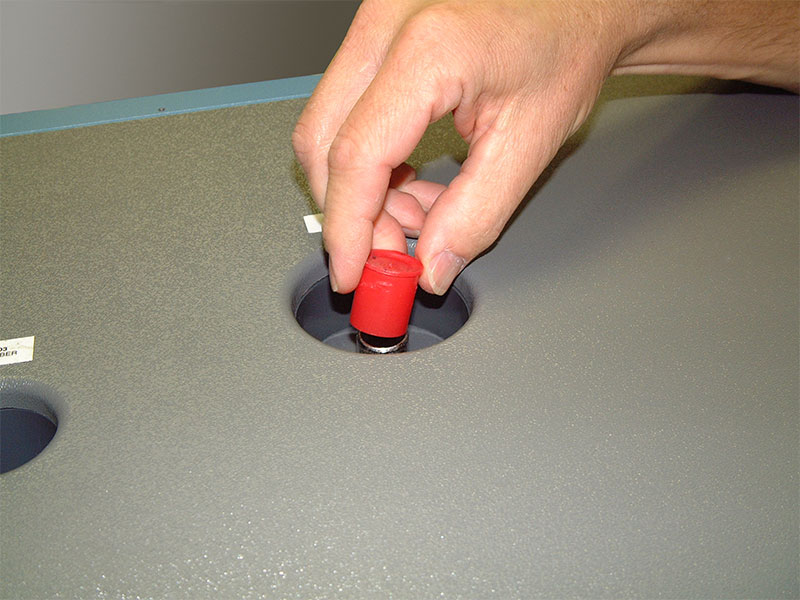
Remove the red chamber fill port cover cap.
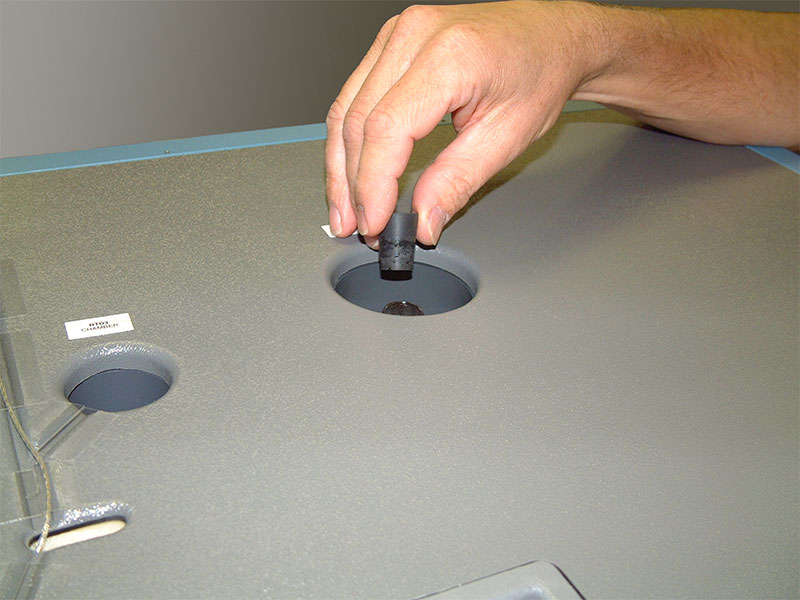
Replace the red cap with a tight fitting rubber plug.
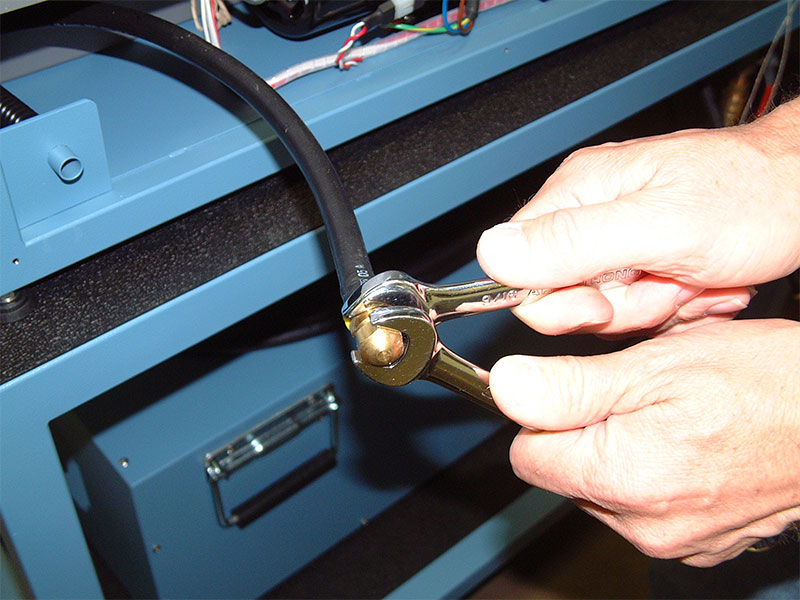
Loosen the chamber fluid drain hose fitting and crimp the hose to prevent fluid loss, remove the fitting cap.
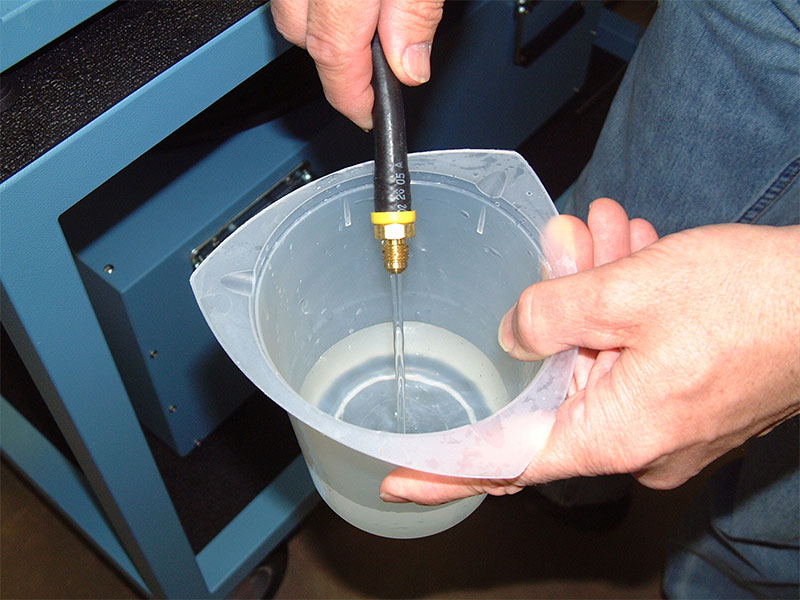
Drain approximately 20 oz. of fluid in a clean container. Fluid will be reused after calibration.
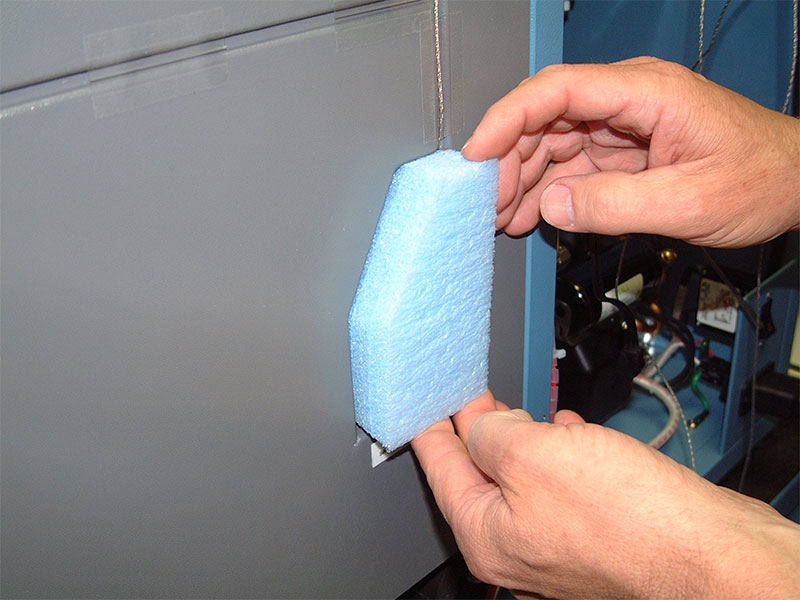
Remove the insulation material from the back panel location labeled RTD0 Saturation Temperature.
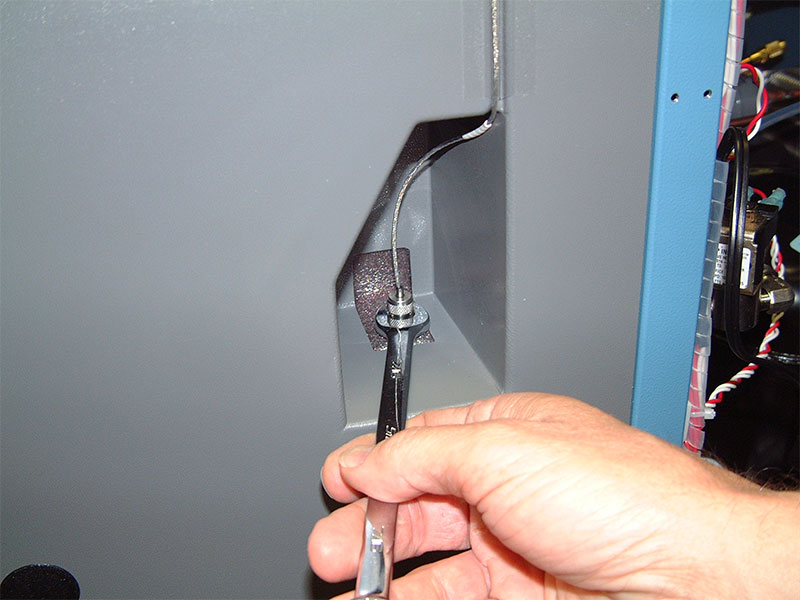
Loosen the 7/16” probe fitting for RTD0.
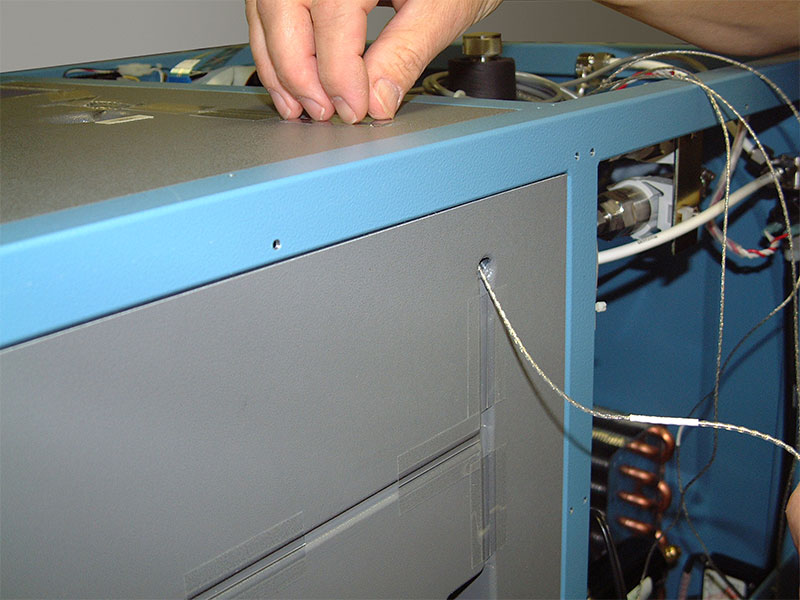
Remove the saturation temperature sensor (RTD0).
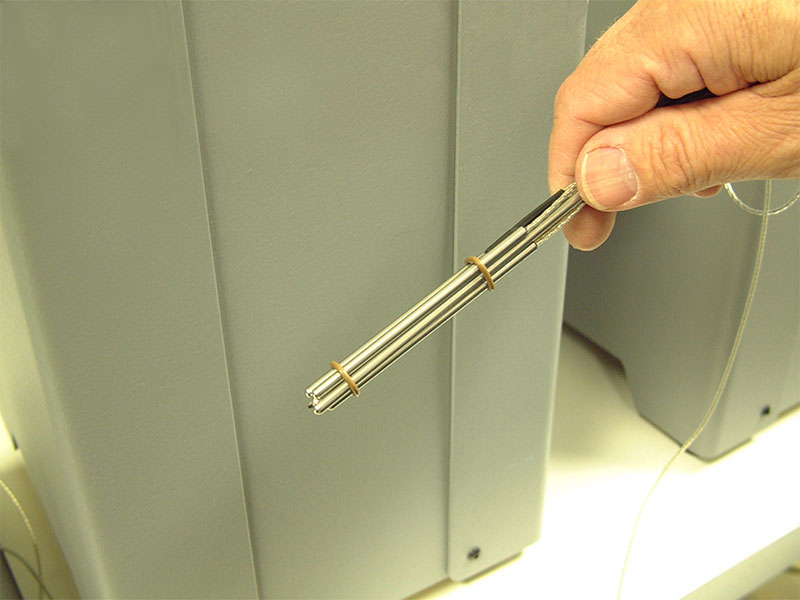
Bundle the 4 temperature sensors together with the PRT or thermistor probe.
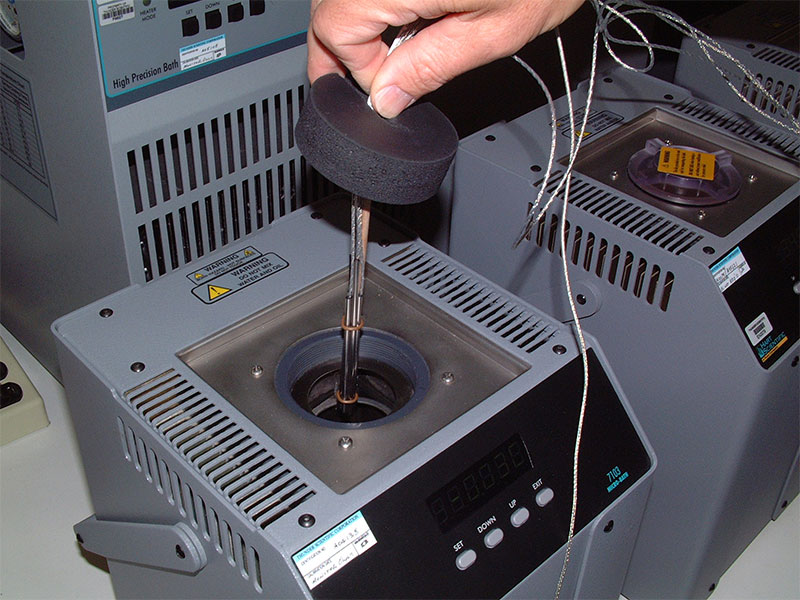
Submerge the temp probes in the fluid circulation bath.
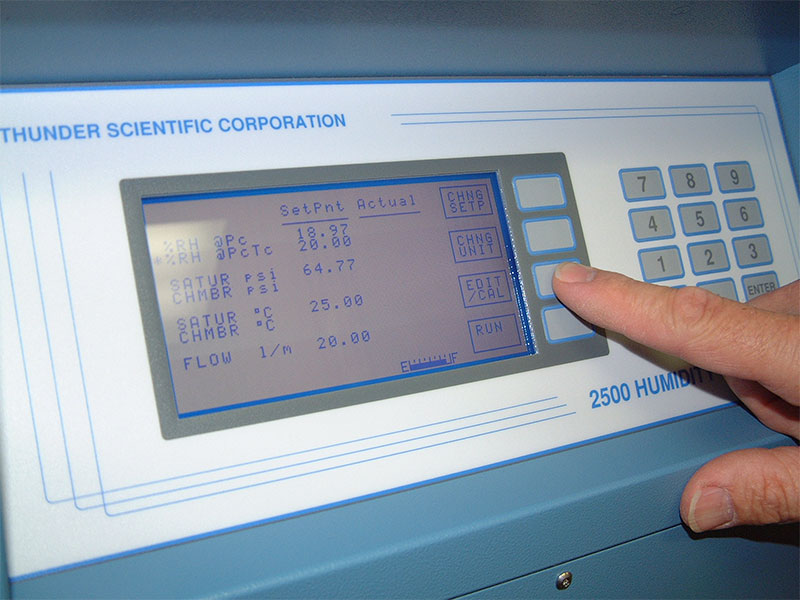
Apply power to the 2500, wait for the system to initialize and display the Control/Display screen.
Press the EDIT/CAL key, the edit cal menu will be displayed.
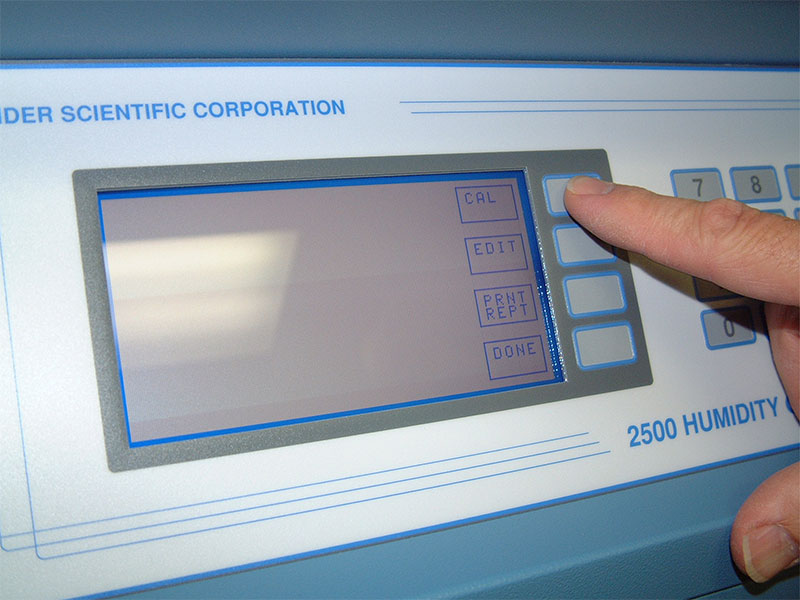
Press the CAL key, the calibration menu will be displayed.
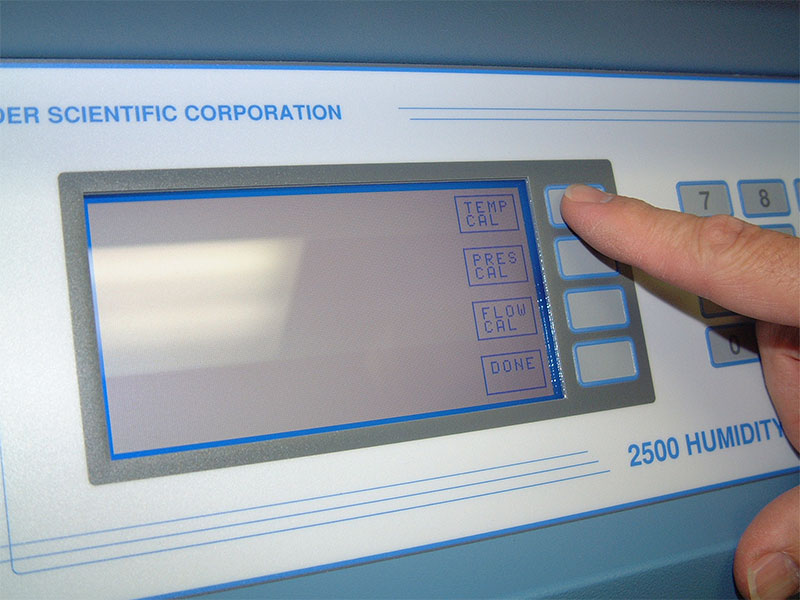
Press the TEMP CAL key, the probe selection screen will be displayed.
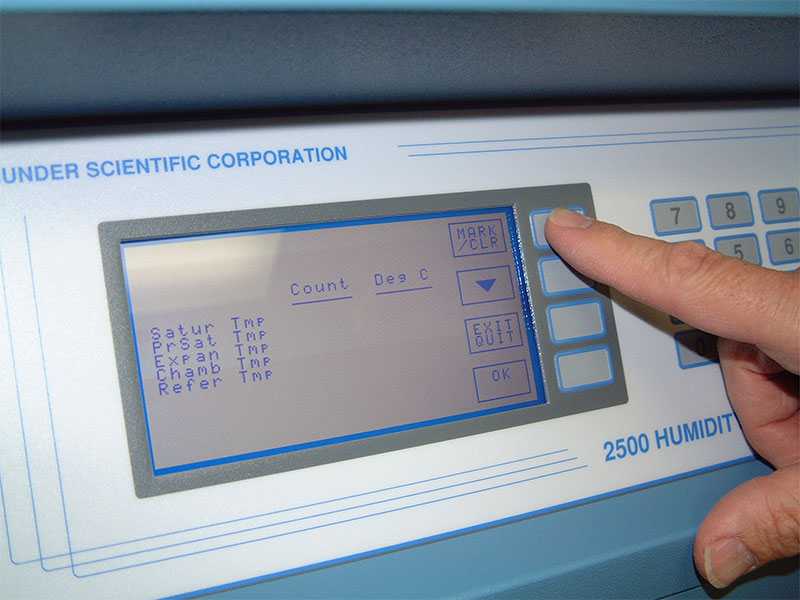
Using the MARK/CLR key and down arrow key mark the probes to be calibrated.
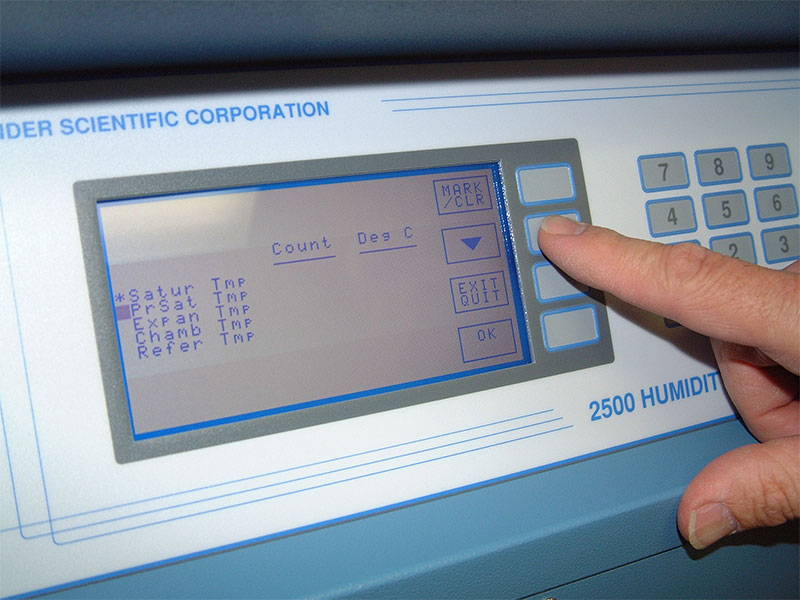
A marked probe is indicated by an asterisk on the left, the Refer Tmp cannot be marked and is displayed as reference only.
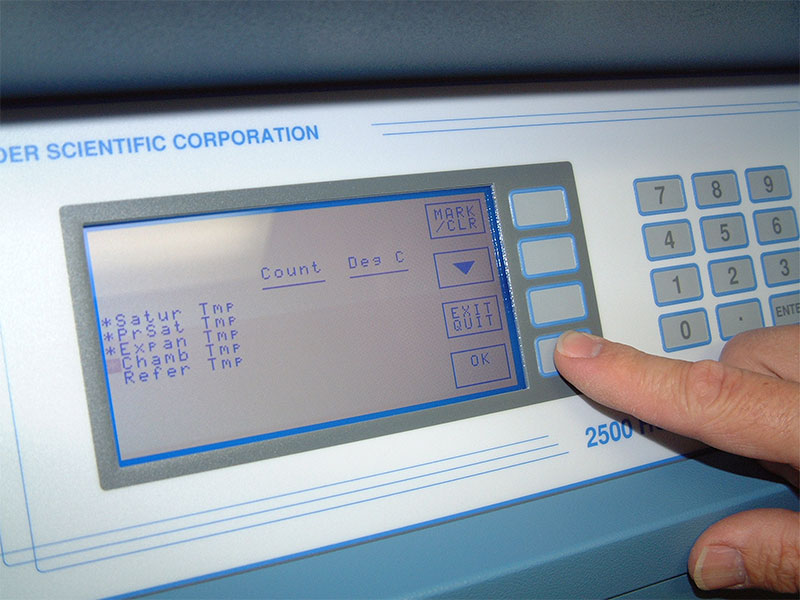
Once the probes are marked press the OK key.
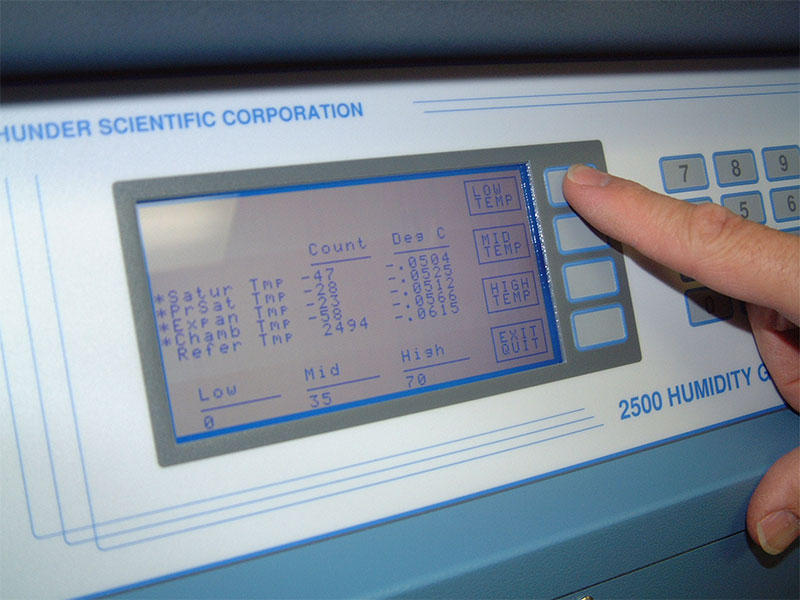
The LOW, MID and HIGH temperature calibration values will be displayed at the bottom of the screen, actual data from the 4 probes will be displayed in the Count and Deg columns.
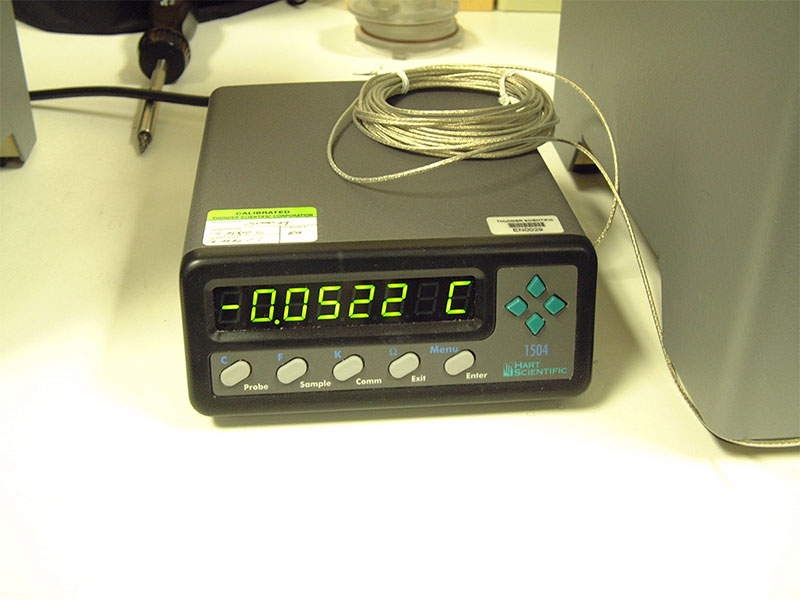
Start the calibration at the first calibration reference point of 0.0 °C allow the system time to stabilize.
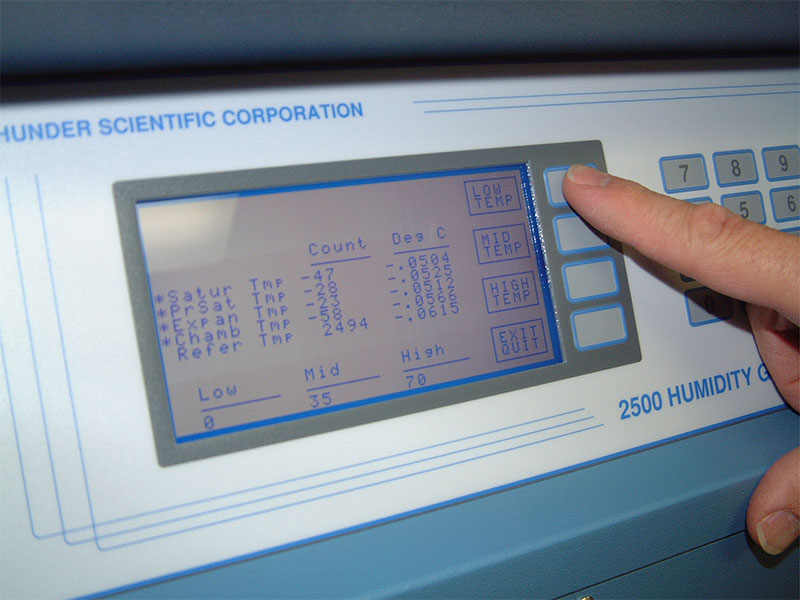
After stabilization press the LOW TEMP key and input the value from the Standard Thermometer at the LOW temperature.
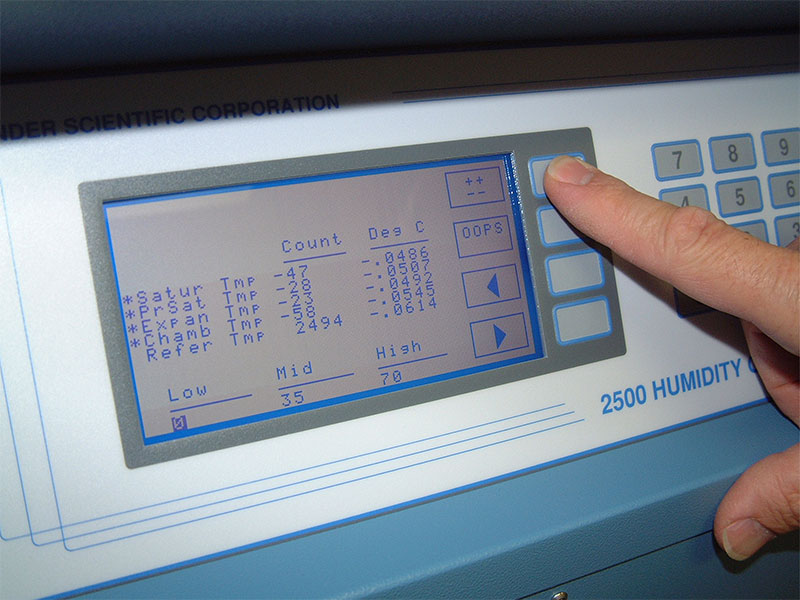
Use the ± key as necessary.
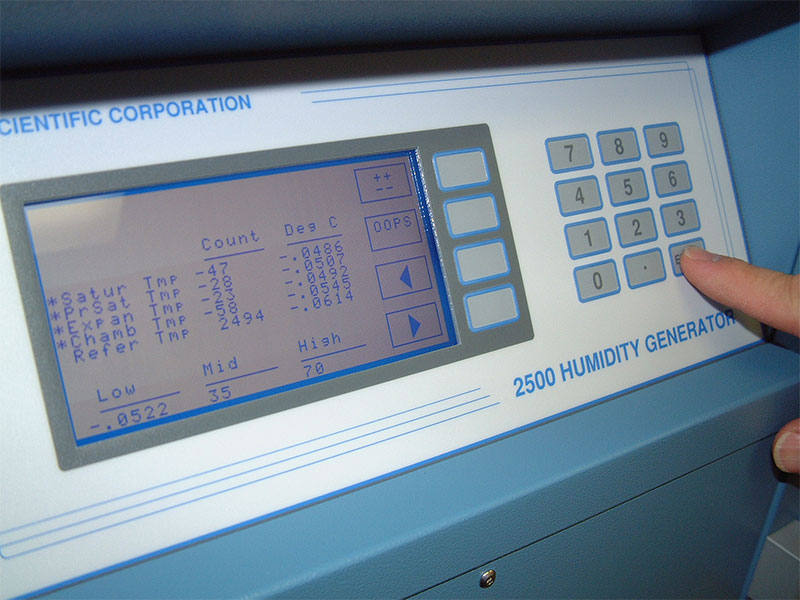
Press ENTER. The LOW temperature value just entered will be displayed under the LOW legend.
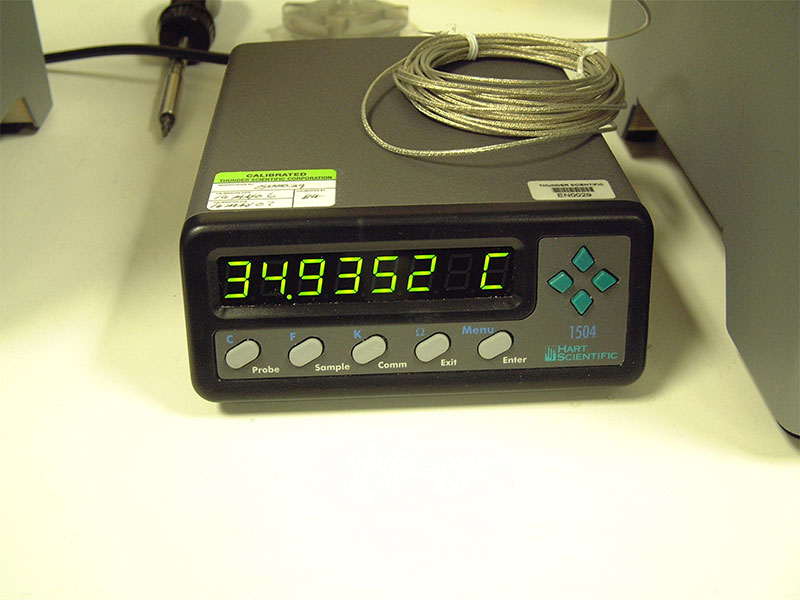
Change the calibration reference point to 35.0 °C allow the system time to stabilize.
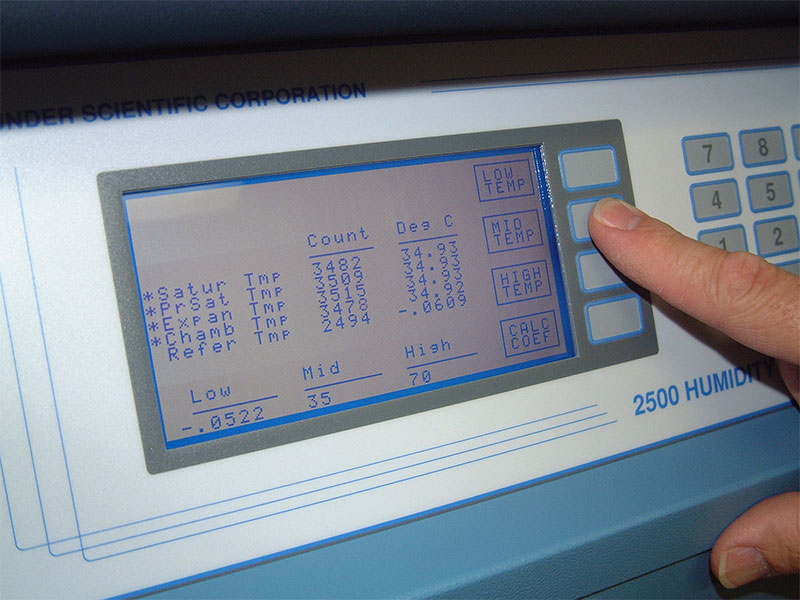
After stabilization press the MID TEMP key and input the value from the Standard Thermometer at the MID temperature.
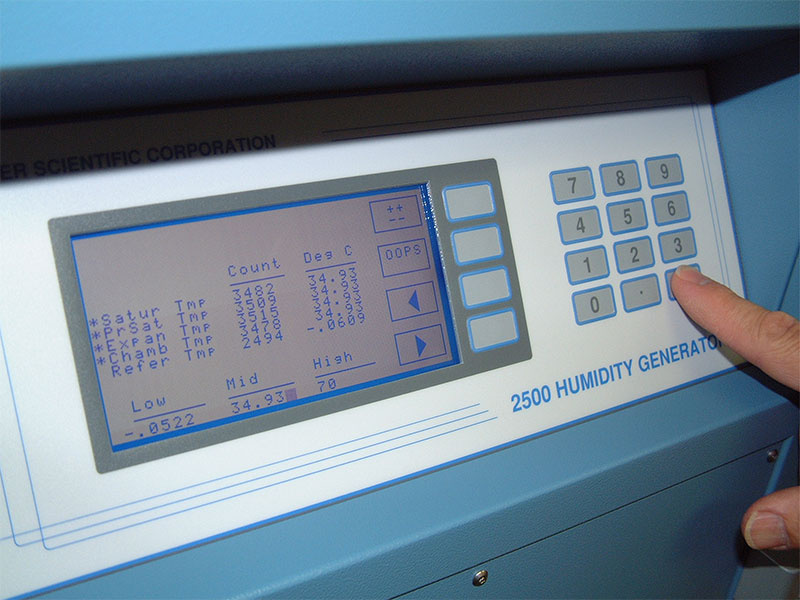
Press ENTER. The MID temperature value just entered will be displayed under the MID legend.
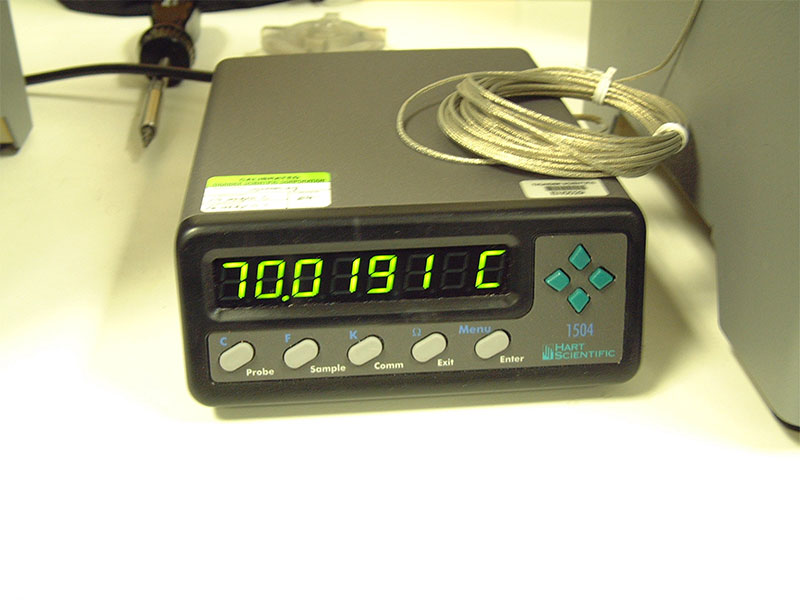
Change the calibration reference point to 70.0 °C allow the system time to stabilize.
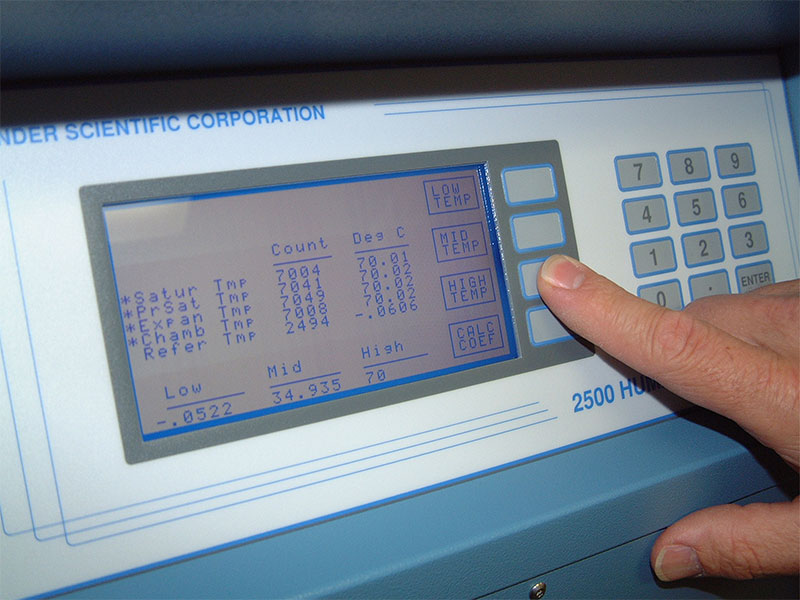
After stabilization press the HIGH TEMP key and input the value from the Standard Thermometer at the HIGH temperature.
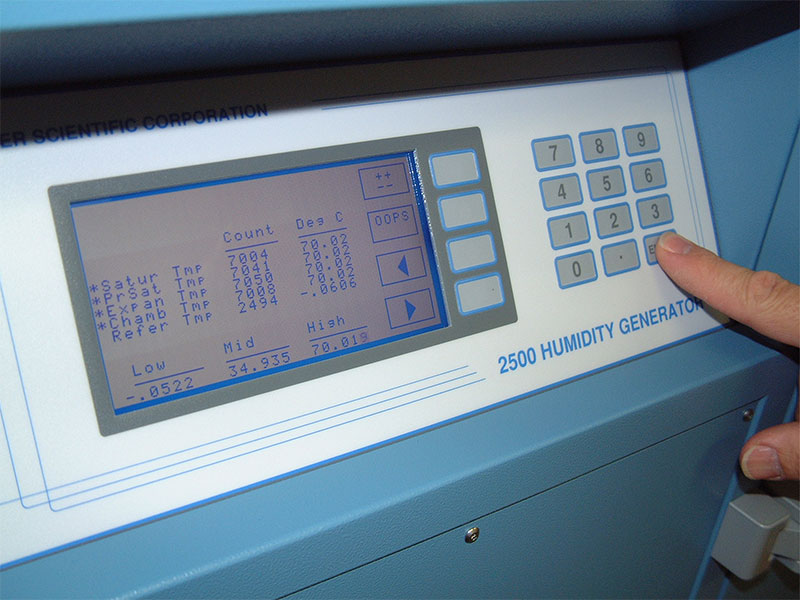
Press ENTER. The HIGH temperature value just entered will be displayed under the HIGH legend.
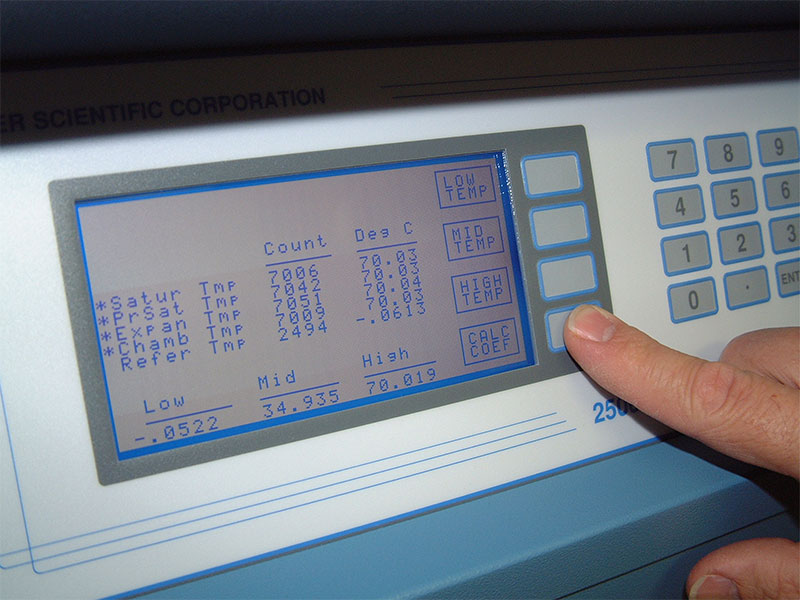
Press CALC COEF key. All coefficients for the marked temperature sensors will be calculated and displayed on the 2500 calibration screen.
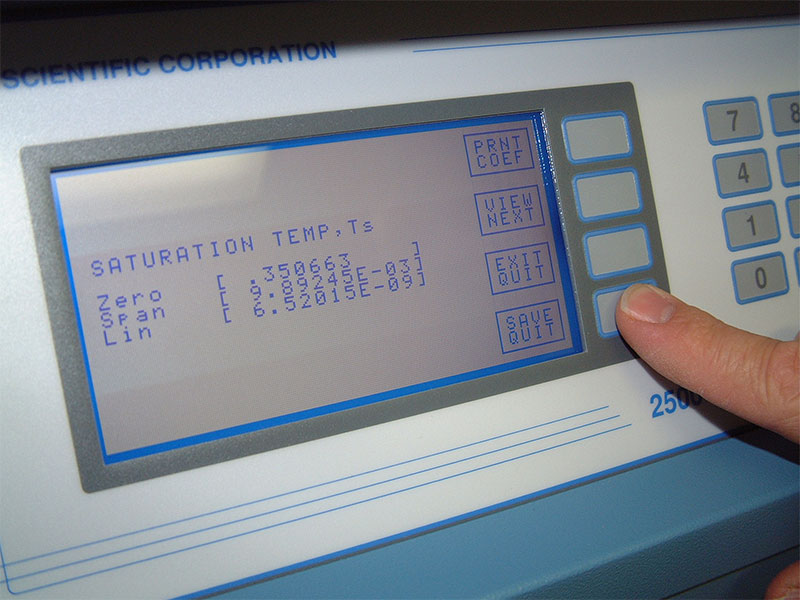
Press SAVE QUIT key, the coefficients will be stored to non-volatile memory.
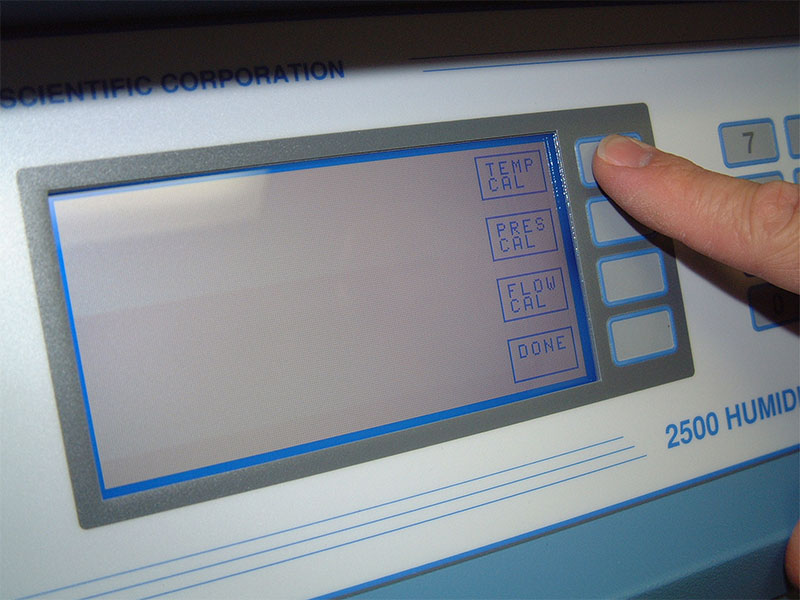
Press the TEMP CAL key.
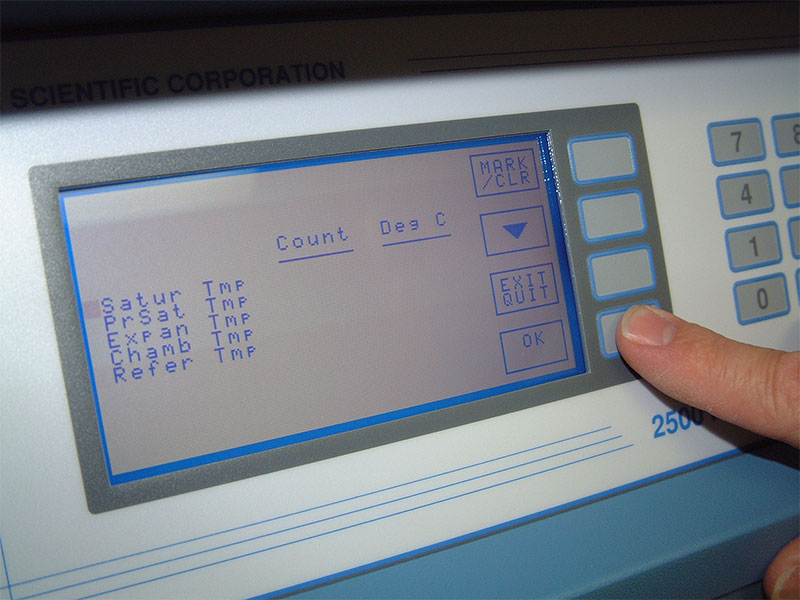
Press OK. Retest as left calibration comparison with the temperature calibration source at 0 °C, 15.0 °C, 25.0 °C, 45.0 °C & 70.0 °C or at random values over the range.
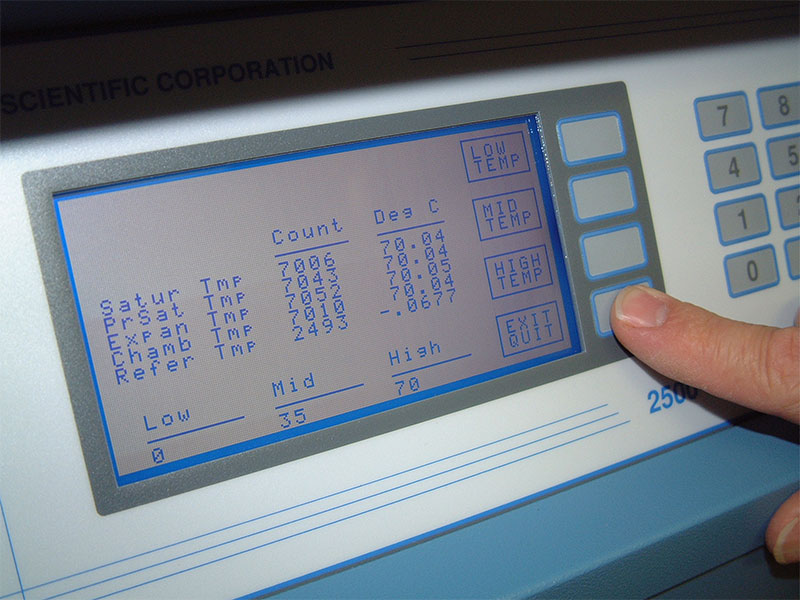
Press the EXIT QUIT Key.
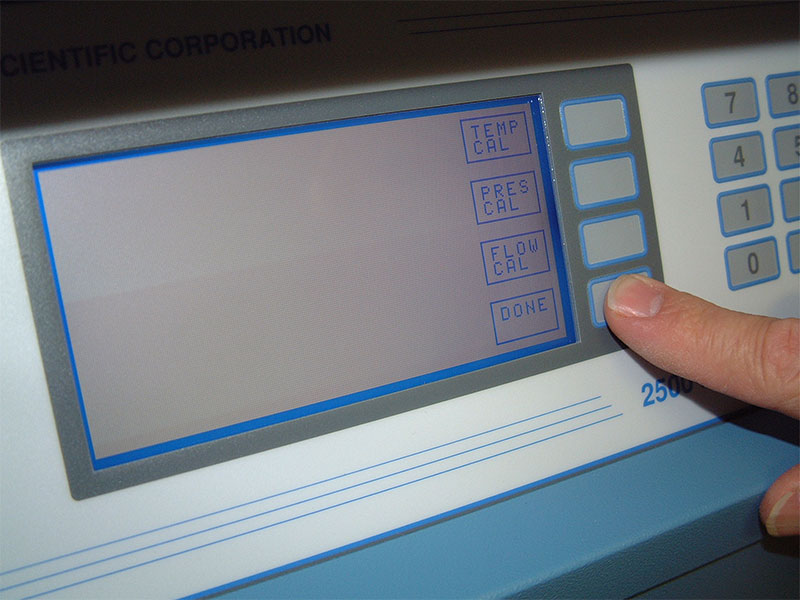
At the calibration menu press DONE, press DONE again, the system will reinitialize to the Control/Display screen.
Printing The Report
If a printer is connected to the Printer Port a report may be printed which lists the calibration coefficients and calibration dates for the pressure and temperature transducers.
The report is printed from the EDIT/CAL menu using the PRNT REPT key.
Repeat the as left calibration inter-comparison using the dew point calibration standard and reference thermometer.
Two-Pressure Humidity Generator
Two-pressure humidity generation entails saturating air or nitrogen with water vapor at a known temperature and pressure. The saturated high-pressure air flows from the saturator and through a pressure-reducing valve, where the gas is isothermally reduced to test pressure at test temperature. Humidity generation does not depend on measuring the amount of water vapor in the air, but instead is dependent only on the measurements of temperature and pressure.
Two-Pressure Principle
Schematic of the Two-Pressure Humidity Generator.

Two-pressure humidity generator.
Error and Uncertainty
Error and uncertainty calculations based on the calibration results of a Model 2500 Two-Pressure Humidity Generator.
- In this section we will analyze the error and uncertainty based on the results from the calibration process.
- We will also help identify the difference between error and uncertainty and the effect the different errors have on the generation of humidity in a Two-Pressure Humidity generator.
It is important not to confuse the terms ‘error’ and ‘uncertainty’.
Error is the difference between the measured value and the ‘true value’ of the item being measured. Whenever possible we try to correct for any known errors; for example, by applying corrections from the calibration process.
Uncertainty is a quantification of the doubt about the measurement result. The uncertainty in a stated measurement is the interval of confidence around the measured value such that the measured value is certain not to lie outside this stated interval.
The Difference Between Error and Uncertainty
A sample assumed to be about 15 %RH is measured by five different instruments, each taking five different readings. The readings, averages and standard deviations from each instrument are shown in the following table:
| Reading 1 | Reading 2 | Reading 3 | Reading 4 | Reading 5 | Average | Std Dev | ||
|---|---|---|---|---|---|---|---|---|
| Instrument A | 15.17 | 15.62 | 14.41 | 14.86 | 16.22 | 15.26 | 0.69 | |
| Instrument B | 15.22 | 15.36 | 15.32 | 15.03 | 15.25 | 15.23 | 0.13 | |
| Instrument C | 18.23 | 18.27 | 18.24 | 18.23 | 18.29 | 18.25 | 0.03 | |
| Instrument D | 15.09 | 16.25 | 12.03 | 17.27 | 16.17 | 15.36 | 2.02 | |
| Instrument E | 15.02 | 16.52 | 15.02 | 15.02 | 15.02 | 15.32 | 0.67 |
Assuming that none of the instruments have been calibrated and are basically new off the factory floor.
To get the answers, mouse over the question and click.
-
- Which instrument has the greatest error?
Unknown
-
- Which instrument has the greatest uncertainty?
Answer = D
The sample is now taken to a highly regarded lab which certifies it is 15.36 %RH.
-
- Which instrument has the smallest error?
Answer = D
-
- Which instrument has the smallest uncertainty?
Answer = C
The Effect Different Errors Have on the Generation of Humidity
Relative Humidity in a two-pressure humidity generator is determined from the measurements of temperature and pressure only and is expressed by the following formula:

Where the f functions are enhancement factors, eS is the saturation vapor pressure, hS is the % efficiency of saturation, Tc and Ts are the chamber and saturation temperatures, and Pc and Ps are the chamber and saturation pressures.
Pre-Saturation Temperature Probe –
The air stream of a two-pressure generator must be 100% saturated with water vapor at test temperature on the high-pressure (saturator) side of the expansion valve. This is accomplished by first passing the air stream through a "pre-saturator". The pre-saturator is a vertical pressure vessel presenting a water surface to the incoming air stream and is maintained constant at a temperature 15 to 20 °C warmer than the desired system (chamber) temperature. The Pre-saturator temperature probe is used in the control of the pre-saturator heaters, which when activated, are used to control this 15 to 20 °C temperature offset. As long as the pre-saturator temperature error is well below this temperature offset, it will have no influence on the computed value of the generated humidity.
Expansion Valve Temperature Probe –
The expansion valve temperature probe is used in the control of the expansion valve heaters, which when activated, are used to warm the expansion valve body, offsetting the cooling effects due to gas expansion. This expansion valve temperature is always maintained around 0.5 °C above the saturation temperature. As long as the expansion value temperature error is well within the 0.5 °C tolerance, it will not influence the computed value of the generated humidity.
Saturator and Chamber Temperature Probes –
During normal operation the chamber and saturator temperatures are very close. In the relative humidity equation, temperatures are computed as a ratio of the corresponding saturation vapor pressures. If no mismatch between the chamber and saturation temperatures exists, then very little error is contributed due to the temperature probe errors. This is true even if the temperature measurement of the two probes is actually incorrect or out of specification, provided that the relative difference between them is zero. Given this, even if both probes were out of specification, but indicated the same numeric value at the same equal temperature, there would be very little error contributed due to temperature.
Saturator and Chamber Pressure Transducers –
The pressure ratio, Pc/Ps, in a two-pressure humidity generator is the major %RH determining factor. Again, this is computed as a ratio, but since the saturator and chamber pressures can very greatly, it does not have the same negating effect that the temperatures ratio does.
Flow Meter –
The flow rate has no influence on the computed value of the generated humidity, but flow rate errors may have an affect on the devices you are calibrating with the Model 2500 Two-Pressure Humidity Generator.
Some Suggested Reading –
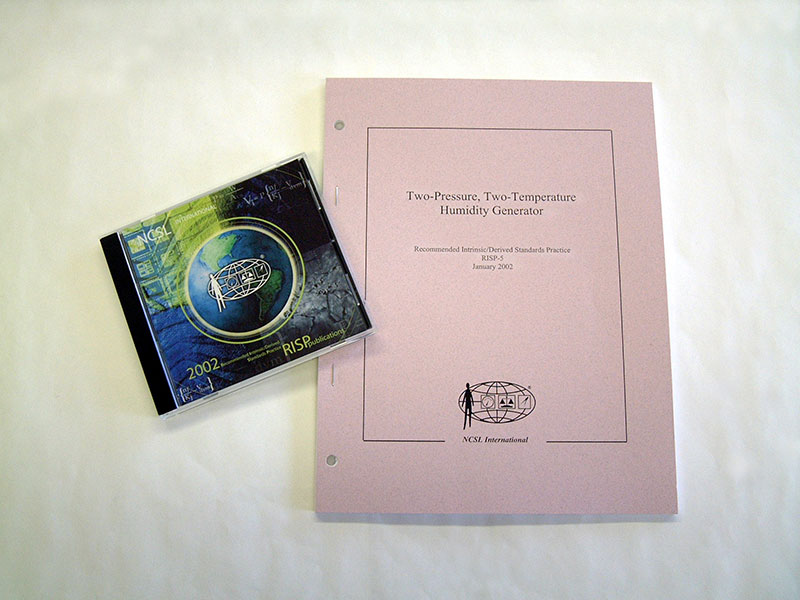
NCSL - RISP- 5
Two-Pressure Two-Temperature Humidity Generator
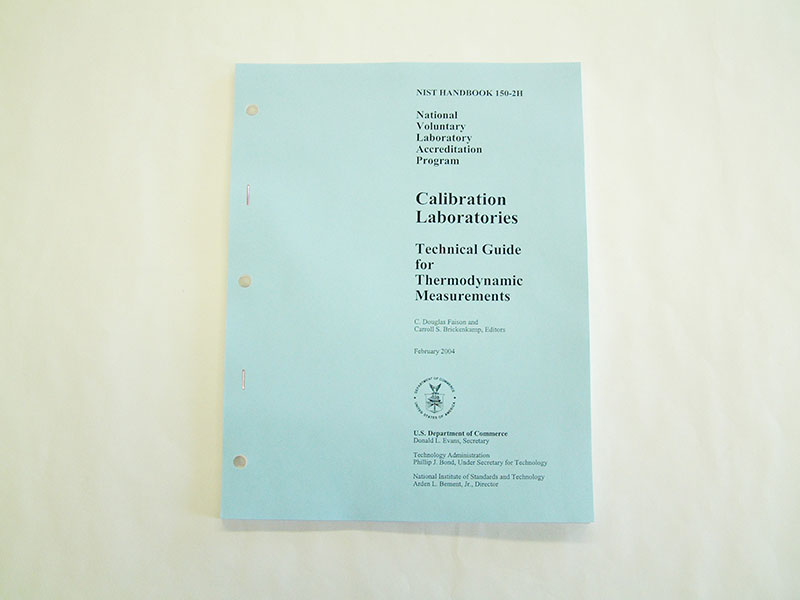
NIST - Handbook 150-2H
Calibration Laboratories Technical Guide for Thermodynamic Measurements
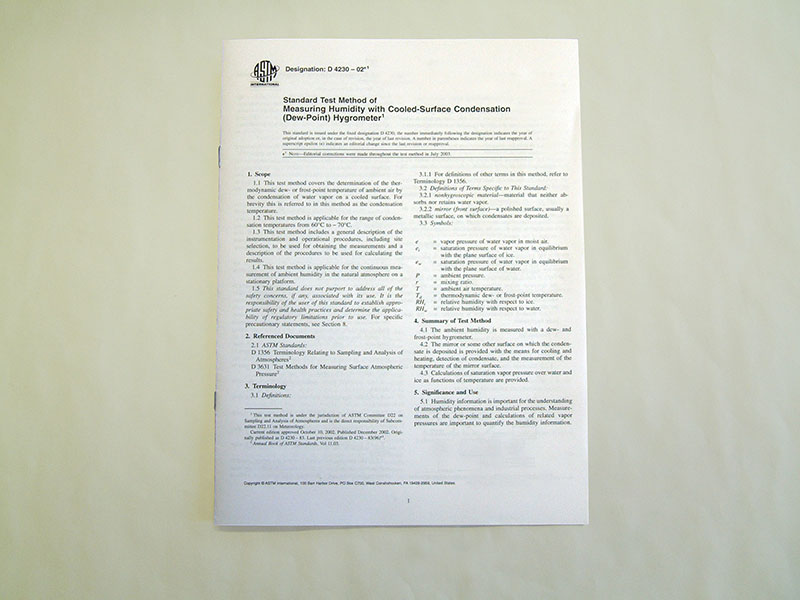
ASTM D 4230-02
Standard Test Method of Measuring Humidity with Cooled-Surface Condensation (Dew-Point) Hygrometer
ASTM E 104-02
Standard Practice for Maintaining Constant Relative Humidity by Means of Aqueous Solutions
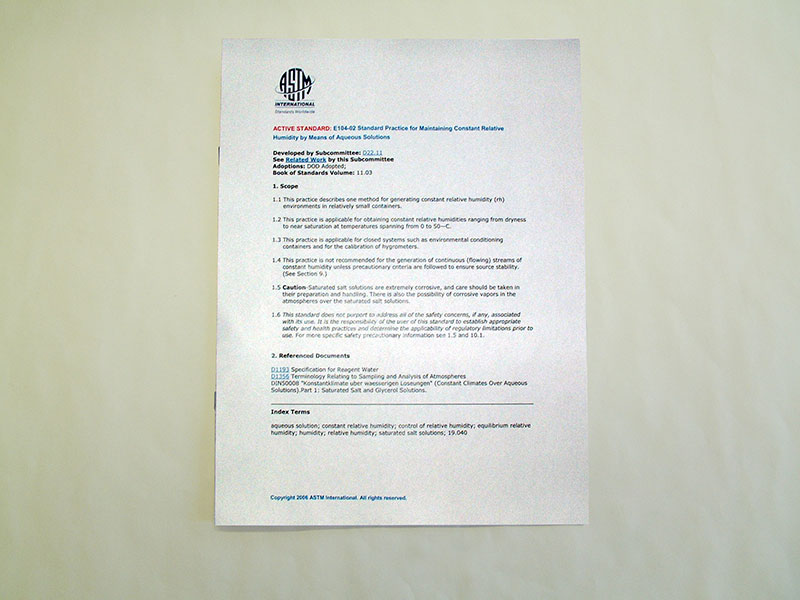
Caution - Saturated salt solutions are extremely corrosive, and care should be taken in their preparation and handling. There is also the possibility of corrosive vapors in the atmospheres over the saturated salt solutions.
ASHRAE Standard - Spc. 41.6-1994R
Standard Method for Measurement of Moist Air Properties
Water Vapor Measurement - Methods and Instrumentation
Author: Peter R. Wiederhold
Thunder wants to Thank You for taking the time to go through this tutorial.
Click here to go back to the Calibration Support page.
Please contact support@thunderscientific.com should you have questions or problems using the procedure. We always appreciate your comments and feedback.
Note:
All the information provided on this website is correct and true at the time of publication. Thunder Scientific Corporation reserves the right to change any technical data without notice.
